Video Streaming Data Usage Calculator
Estimate streaming data by resolution, codec, HDR, frame rate, viewing hours, active screens, and network overhead.
🎬Real Streaming Presets
📶Streaming Inputs
Streaming Data Estimate
📊Spec Comparison Grid
📐Reference Tables
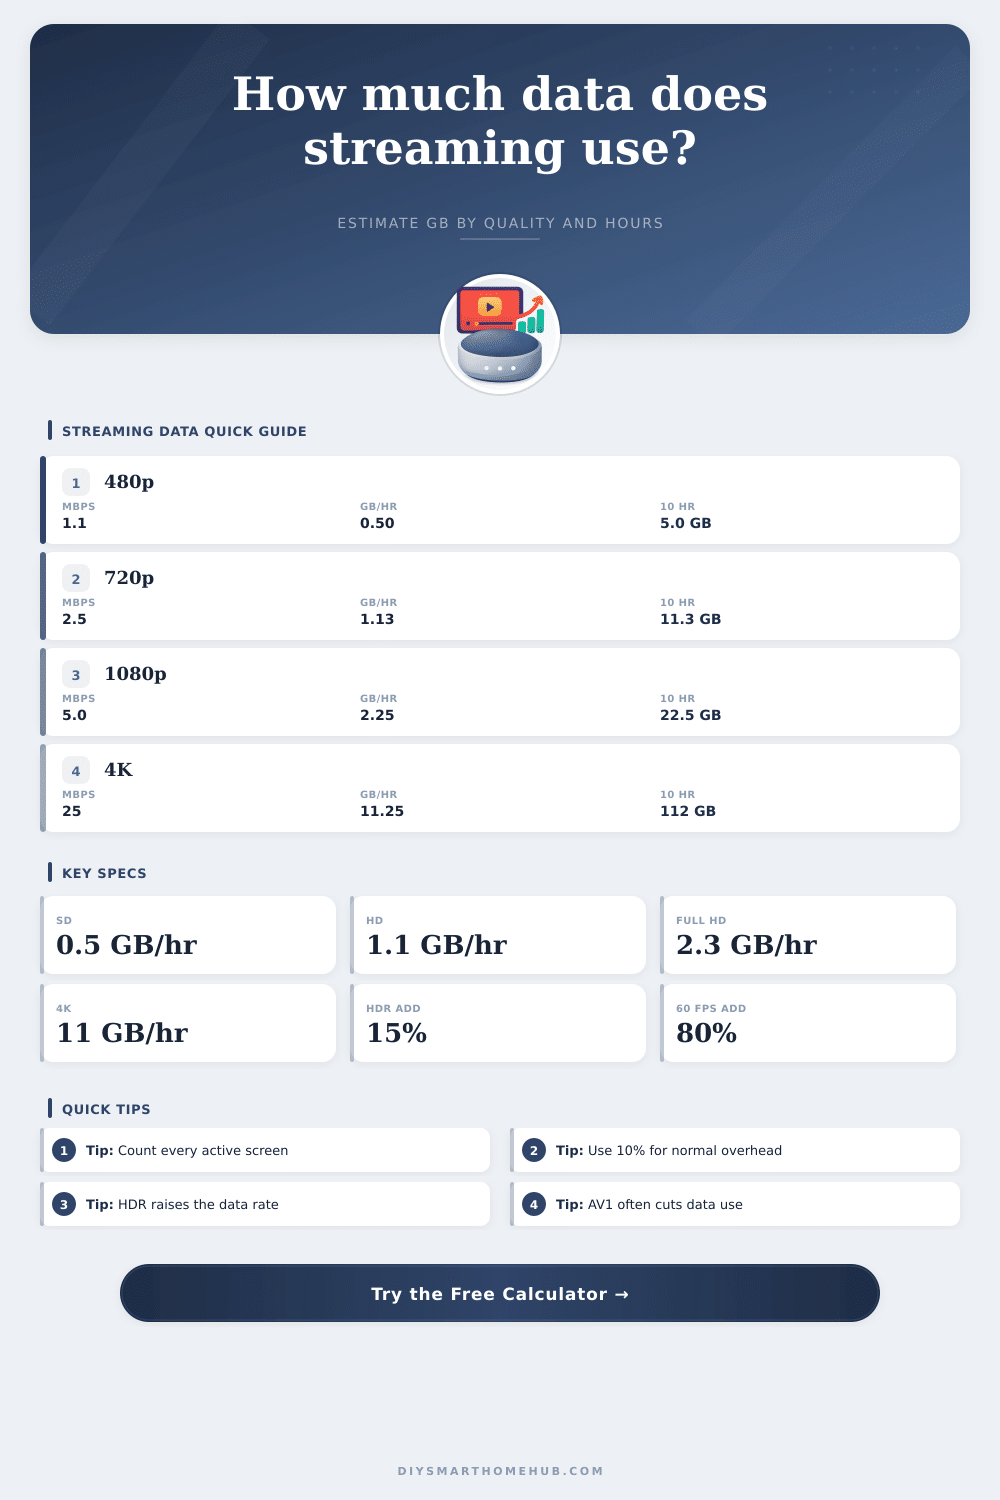
Common Streaming Bitrate and Data Usage
| Quality | Base Mbps | GB Per Hour | Data For 10 Hours | Typical Use |
|---|---|---|---|---|
| 480p SD | 1.1 Mbps | 0.50 GB | 5.0 GB | Phones, small tablets, data saver viewing |
| 720p HD | 2.5 Mbps | 1.13 GB | 11.3 GB | Tablets, laptops, smaller TVs |
| 1080p Full HD | 5.0 Mbps | 2.25 GB | 22.5 GB | Main TVs and general home streaming |
| 1440p QHD | 12 Mbps | 5.40 GB | 54.0 GB | High-detail monitors and creator review |
| 2160p 4K UHD | 25 Mbps | 11.25 GB | 112.5 GB | Large TVs, premium movies, 4K originals |
| 4320p 8K UHD | 80 Mbps | 36.00 GB | 360.0 GB | Short demos and very high resolution tests |
Codec Efficiency Reference
| Codec | Calculator Factor | Typical Data Change | Best Fit | Planning Note |
|---|---|---|---|---|
| H.264 / AVC | 1.00 | Baseline | Older TVs and broad compatibility | Use when you do not know the stream codec |
| VP9 | 0.65 | About 35% less | Many browser and smart TV streams | Common for high-resolution web video |
| H.265 / HEVC | 0.60 | About 40% less | 4K TVs, streaming boxes, phones | Often used for 4K and HDR delivery |
| AV1 | 0.50 | About 50% less | Newer TVs, browsers, and devices | Efficient for data caps when supported |
Device and Household Capacity Examples
| Scenario | Streams | Quality | Hours Per Day | Monthly Data |
|---|---|---|---|---|
| Phone data saver | 1 | 480p H.264 | 1 hour | About 15 GB |
| Single HD TV | 1 | 1080p H.264 | 3 hours | About 74 GB |
| Two HD screens | 2 | 1080p H.264 | 4 hours | About 198 GB |
| 4K family TV | 1 | 4K HEVC | 3 hours | About 223 GB |
| Shared apartment | 3 | 1080p HEVC | 4 hours | About 267 GB |
| 4K HDR heavy use | 2 | 4K HEVC HDR | 4 hours | About 615 GB |
Monthly Plan Stress Test
| Monthly Data | 480p Hours | 1080p Hours | 4K Hours | 4K HEVC Hours |
|---|---|---|---|---|
| 100 GB | 202 hours | 44 hours | 9 hours | 15 hours |
| 300 GB | 606 hours | 133 hours | 27 hours | 44 hours |
| 500 GB | 1010 hours | 222 hours | 44 hours | 74 hours |
| 1 TB | 2020 hours | 444 hours | 89 hours | 148 hours |
💡Calculation Tips
Video streaming account for a great deal of data usage at home, and video streaming can make it very likely that a household will exceed it’s data allowance for the month. Many individual may not become aware that there data allowance is being consumed at all until they recieve a warning email from their internet provider. One tool that is available to assist individuals in understanding the amount of data that their video streaming may consume is a data calculator.
Data calculators requires that individuals input several different values in order to determine the amount of data that their household will consume. Factors that can influence the data consumption of an individual include the resolution of the videos that are streamed, the codec that is use for those videos, the frame rate of the videos, and factors like high dynamic range (HDR) settings. Factors like the number of screens that is streaming videos and the number of hours that those screens are streaming videos will also influence the amount of data that is consumed.
How to Use a Data Calculator for Video Streaming
Finally, factors like overhead data and adaptive streaming can also have an impact on the amount of data that is used for video streaming. Each of these factor can be accounted for when using a data calculator in order to understand how much data will be consumed. The way in which individuals watch videos have an impact upon the amount of data that is used, as well as upon the way in which they may manage that data.
For instance, individuals who use video media as background noise for shorter period of time will use less data than individuals who watch video for longer periods of time. Thus, each of these factors can have an impact upon data consumption, but management of those factors will prevent individuals from consuming too much of their data allowance. If individuals are aware that they spend a great deal of time streaming videos on a variety of screen, for instance, they can adjust the resolution of the videos to reduce the amount of data that it consume.
Factors like the use of different codec for video media and the use of features like HDR will impact the amount of data that is consumed by different devices. For instance, if an individual has an older smart TV, the smart TV may not support codecs like AV1, which are more data efficient than codecs like H.264. Thus, the resolution settings for those devices would use more data with one codec than with another.
Additionally, because the use of HDR features increases the amount of data that is used, the individual can reduce data consumption by turning of those features. For instance, those features could be turned off during the day and turned on during the evening when higher quality video is desire. The reference tables included in data calculators can be used to understand the impact of different video settings upon the amount of data that is consumed.
For instance, the reference tables make it easy for individuals to understand how many hour of 4K video can be watched within a given data allowance for those hours, as compared to the number of hours of 1080p video that can be watched within the same data allowance. These tables enable individuals to see how high resolutions require more data than lower resolutions for video watching. Additionally, the reference tables also enable individuals to recognize that a great many streaming screens will deplete an individual’s data allowance much more quickly than fewer streaming screen.
The main value of a data calculator is that it allow individuals to test the impact of small change to their video streaming habits prior to exceeding their data allowance. For instance, individuals can use a data calculator to determine whether changing the resolution of one screen from 4K to 1080p will allow the individual to remain within their data cap. Additionally, individuals can use a data calculator to determine if turning off HDR features on their screens will provide enough breathing room in their data allowance.
Thus, individuals can use the data calculator to make specific changes to their habits in order to ensure that they are not surprised by bills for excessive data consumption.