Temperature Humidity Index Calculator
Calculate THI from air temperature and relative humidity, compare indoor comfort and livestock heat-stress bands, and add practical sensor, airflow, and radiant-load margins for smart-home automations.
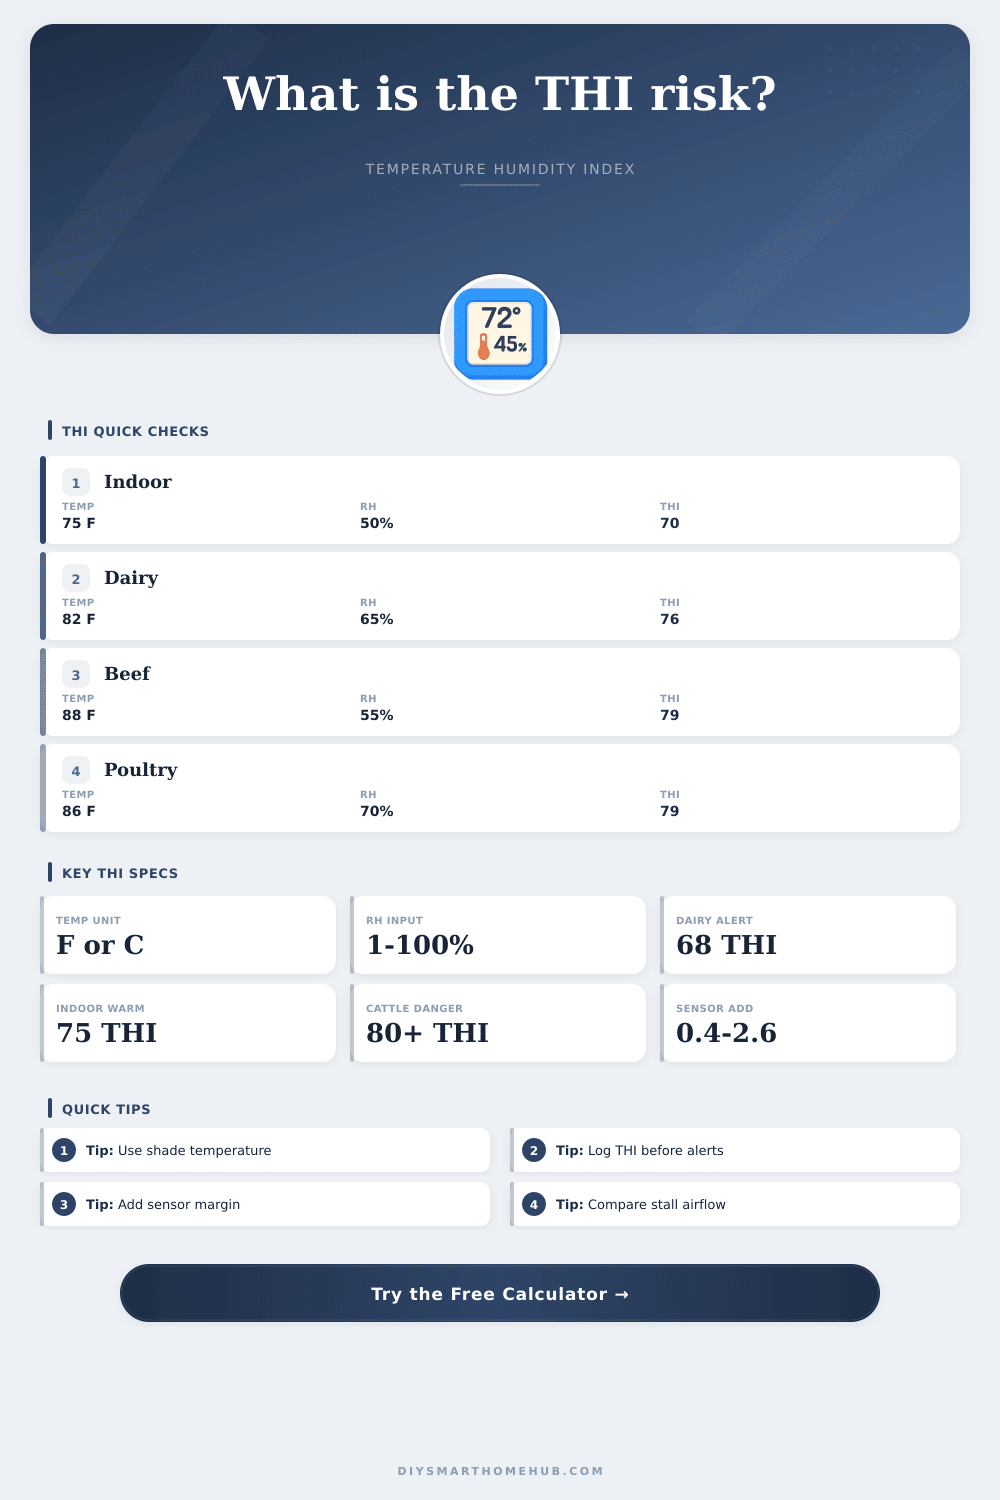
🎯THI Presets
⚙Temperature, Humidity, And Use Inputs
📊Current THI Snapshot
📘Temperature Humidity Index Reference Tables
| Formula family | Equation used by calculator | Temperature input | Best use | Important limit |
|---|---|---|---|---|
| Livestock THI, Celsius form | (1.8 x T C + 32) - (0.55 - 0.0055 x RH) x (1.8 x T C - 26) | Dry-bulb C | Dairy, beef, poultry, barn sensors | Reference bands vary by species and management |
| Livestock THI, Fahrenheit form | T F - (0.55 - 0.55 x RH decimal) x (T F - 58) | Dry-bulb F | Cattle-oriented quick checks | Nearly tracks common livestock THI tables |
| Indoor discomfort index | T C - (0.55 - 0.0055 x RH) x (T C - 14.5) | Dry-bulb C | Rooms, bedrooms, offices | Result is a comfort index, not a medical heat index |
| Simple warm-air THI | 0.8 x T C + RH x (T C - 14.4) / 100 + 46.4 | Dry-bulb C | Warm indoor comparisons | Useful for trends, less species-specific |
| Dairy cattle THI band | THI range | Typical interpretation | Smart-home or barn automation | Sensor placement note |
|---|---|---|---|---|
| No heat stress | Below 68 | Below common dairy alert threshold | Trend logging only | Measure near occupied stall height |
| Mild stress | 68 to 71 | Early production and comfort pressure | Start watch or fan readiness logic | Use shade and avoid wall heat |
| Moderate stress | 72 to 79 | Active cooling attention | Escalate fan or ventilation alerts | Compare feed alley and resting area |
| Severe stress | 80 to 89 | High-risk barn condition | High-priority occupied-zone alert | Use multiple sensors if airflow is uneven |
| Emergency | 90 and above | Critical heat-stress condition | Critical notification threshold | Confirm with reference sensor immediately |
| Indoor comfort band | Index range | Room interpretation | Good automation use | Example space |
|---|---|---|---|---|
| Comfortable | Below 70 | Usually comfortable for light activity | Normal climate logging | Bedroom, office, living room |
| Slightly warm | 70 to 74 | Humidity begins to matter | Watch rising humidity or closed rooms | Basement, nursery, pet room |
| Warm | 75 to 79 | Occupants may feel muggy or heavy | Fan, dehumidifier, or HVAC alert logic | Sunroom, upstairs bedroom |
| Hot | 80 to 84 | Comfort drops for most occupied spaces | High-priority occupied-room alert | Garage, workshop, greenhouse entry |
| Very hot | 85 and above | Use caution for sensitive occupants | Critical local alert threshold | Attic access, enclosed porch |
| Preset scenario | Typical temp/RH | Recommended profile | Expected THI behavior | Best comparison point |
|---|---|---|---|---|
| Living room comfort | 75 F / 50% RH | Indoor human comfort | Comfortable to slightly warm | Thermostat-area sensor |
| Humid basement | 72 F / 72% RH | Indoor human comfort | Muggy before it feels hot | Absolute humidity or dew point |
| Dairy barn afternoon | 82 F / 65% RH | Dairy cattle heat stress | Moderate heat-stress band | Resting stall THI |
| Beef pen heat watch | 88 F / 55% RH | Beef cattle heat stress | High caution in sun-loaded pens | Shade versus open pen sensor |
| Poultry house check | 86 F / 70% RH | Poultry house heat stress | Ventilation margin matters | Bird-height temp/RH sensor |
📟Sensor / Spec Comparison Grid
| Sensor / spec profile | Temperature accuracy used | RH accuracy used | Typical response | Best THI role |
|---|---|---|---|---|
| Basic indoor temp/RH puck | +/-0.9 F / +/-0.5 C | +/-3% RH | Medium | Room comfort and trend checks |
| Zigbee smart climate sensor | +/-0.7 F / +/-0.4 C | +/-2.5% RH | Medium | Smart-home automation threshold |
| Outdoor shielded sensor | +/-0.5 F / +/-0.3 C | +/-2% RH | Fast | Outdoor shade or patio reference |
| Barn-rated sensor node | +/-1.1 F / +/-0.6 C | +/-4% RH | Medium | Livestock area monitoring |
| Aspirated reference station | +/-0.3 F / +/-0.2 C | +/-1.5% RH | Fast | Reference THI for comparisons |
| Remote probe plus RH module | +/-1.8 F / +/-1.0 C | +/-5% RH | Slow | Attic, enclosure, or roof-load checks |
💡THI Planning Tips
The temperature humidity index, or THI, is a measurement of temperature and humidity into one number. The temperature humidity index indicate the total heat load that an individual or animal will experience. If the humidity and the temperature of an area are high, the body will find it difficult to cool itself through the evaporation of sweat.
High humidity prevent an individual or animal from being able to release heat from its body effective. As a result, the individual or animal will experience heat stress even if the temperature of the area isnt high. The temperature humidity index will vary according to the individual that is being consider.
Temperature Humidity Index (THI): How Heat and Humidity Affect Animals
For example, dairy cattle tend to react differently to heat than do poultry. Dairy cattle often experience a decline in the production of they milk if the temperature humidity index is high. Poultry, on the other hand, dont have any sweat gland to release heat from its body.
Profiles can be set for the index to reflect the type of animals that are to be contained within that space. Each profile will have a specific temperature humidity index that is appropriate for the type of animal that is contained within the space; using the incorrect profile for an animal may lead to danger for that animal. Air movement within a location will impact how hot an individual or animal feels.
An area that is stagnant in relation to air movement will often feel hotter than an area that is experiencing breezes. In stagnant area, moisture cannot leave the skin (or the feathers of an animal) as quick as it can in an area that experiences air movement. Air movement can be accounted for with an airflow offset within the index calculation.
Air movement will impact the index but will not impact the humidity and temperature of the area; therefore, calculating the offset separately from the humidity and temperature is appropriate. Another factor that may impact the heat load that an individual or animal experiences is the presence of radiant heat. Radiant heat is heat that enters the body from surfaces that are warmed by the sun, such as the roof of a barn or barn window.
Such heat can raise the temperature that the animal feels without increasing the actual air temperature of the area. A radiant heat allowance can be added to the calculation to determine the true heat load that the individual or animal is experiencing. People may ignore the radiant heat allowance in their calculations.
As a result, they may not have an accurate understanding of the reason that an animal is seeking shade. In order to calculate the temperature humidity index accuratly, sensors must be accurate. If the humidity and temperature sensors provide incorrect reading of any variable, the index will provide an incorrect calculation of the heat load that an individual or animal is to be experienced in that location.
The sensors may be provided with high-side tolerance, ensuring that any alert based on the index reflects the worst possible outcome. By calculating the index based on the worst possible outcome, the system sends the alerts early rather than late. The dew point can be calculated from the same variables that are used to calculate the temperature humidity index.
The dew point represent the temperature of the environment at which the air within the area becomes saturated with moisture. If the dew point is close to the air temperature within the area, it is likely that the air within the area is saturated with moisture. This may indicate whether the space should use dehumidification system or if the airflow within the area should be increased.
The sensors can be placed in any locations within the area. If the sensors are placed in areas that are exposed to the sun or to heat source within the area, the sensors may measure temperatures that are higher than those of the area that is to be measured. Sensors should be placed in areas that is shaded to reflect the true temperature of the area.
The location of the sensors should reflect the type of calculation that is to be perform with the index. Various conditions within an area will change throughout the day. Therefore, it is not appropriate to rely upon a single measurement of the temperature humidity index.
The temperature humidity index may be low at the time of morning measurement, but may be high in the afternoon. In order to monitor the area, individuals may choose to take regular measurement of the temperature humidity index. If logging the index measurement, managers may be able to adjust the ventilation of an area based off the temperature humidity index reading.
This can help prevent heat stress for the individual or animals in that area. The temperature humidity index has limitations in the factor that it considers. For instance, the temperature humidity index does not account for the acclimation of an animal to hot weather, the diet of the animal, the health of the animal, or whether the animal has access to water and is exhibiting physical activity that creates heat.
Because these factor are not accounted for in the index, the behavior of the animals should still be observed within the area. Monitoring the animals behavior and calculating the temperature humidity index is the most effective mean of managing heat for those animals.