Smart Light Schedule Energy Calculator
Estimate daily, monthly, and yearly kWh for smart bulbs and fixtures using rated watts, schedule hours, dimming scenes, occupancy automation, days used, and standby draw.
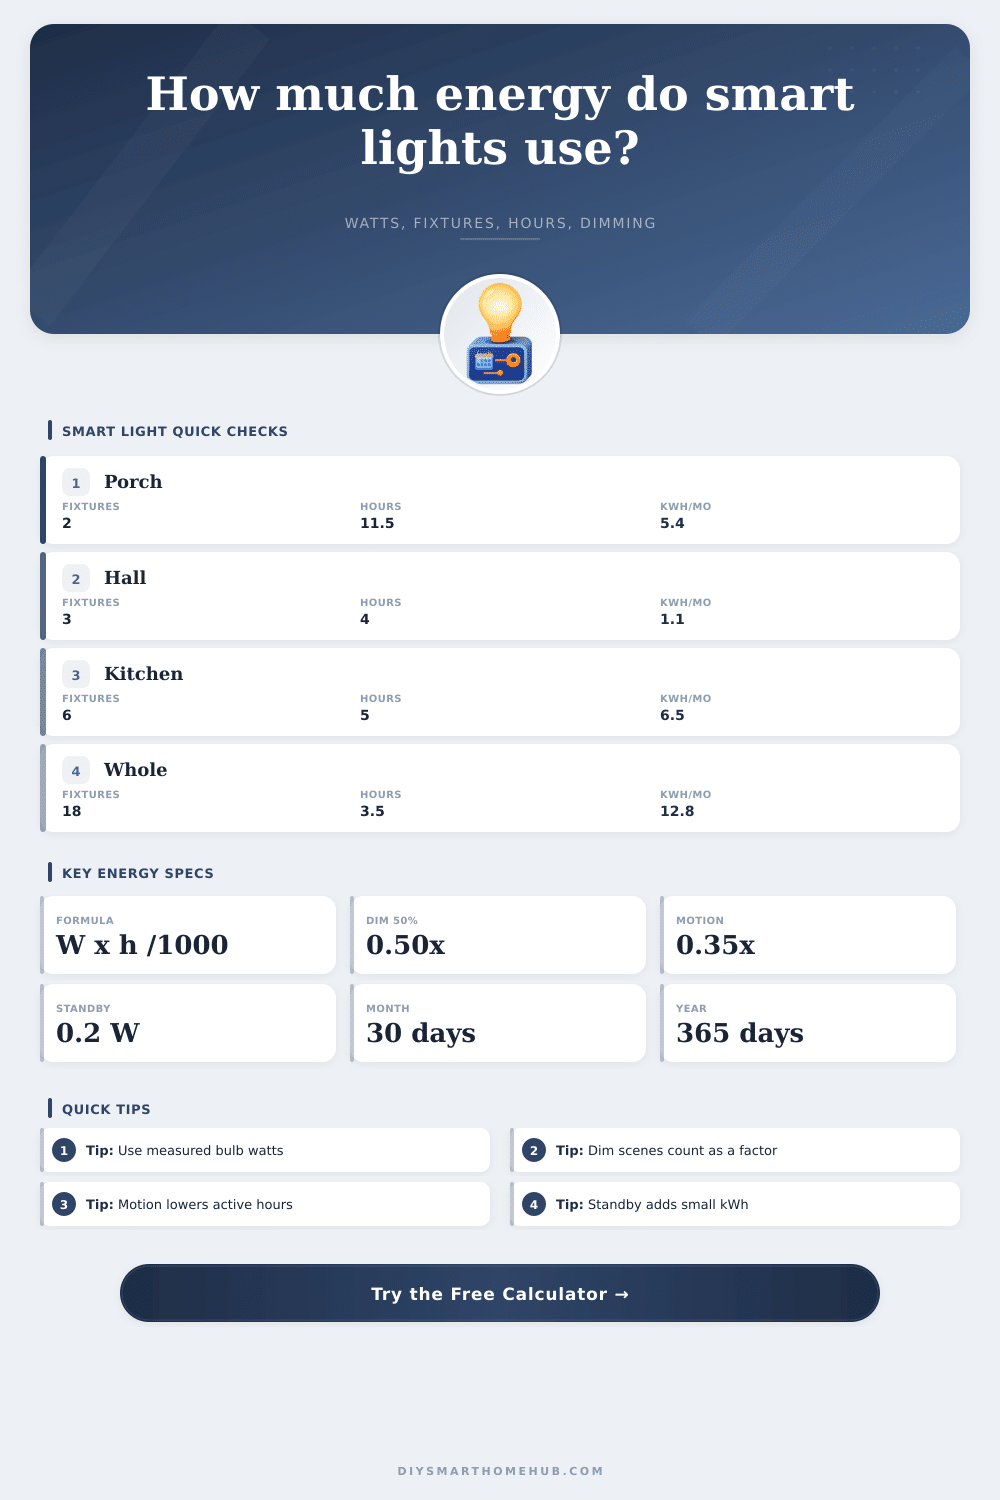
A19 tunable white smart bulb
Energy Schedule Results
Schedule Preset Energy Examples
These examples use the same formula as the calculator: fixtures x watts x hours x dimming factor x occupancy factor / 1000, plus standby kWh.
| Preset | Fixture basis | Schedule factors | Estimated kWh/month |
|---|
Bulb Type and Watt Assumptions
Use measured watts when available. The table gives common planning values for smart lamps and integrated fixtures.
| Smart light type | Active watts | Standby watts | Typical use |
|---|
Dimming Factor Table
The calculator treats average dimming as a direct power factor, which is the clearest planning approximation for schedule kWh.
| Scene level | Factor used | Example with 8 W bulb | Best fit |
|---|---|---|---|
| 25% accent | 0.25 | 2.0 W effective | Night path, soft lamp |
| 40% evening | 0.40 | 3.2 W effective | TV room, bedroom fade |
| 60% task mix | 0.60 | 4.8 W effective | Kitchen prep, office fill |
| 80% bright | 0.80 | 6.4 W effective | Porch, bath vanity, garage |
| 100% full | 1.00 | 8.0 W effective | Security flood, cleanup scene |
Occupancy Factor Guide
Occupancy factor means the percentage of the scheduled window when the light is actually on after motion, presence, or manual scene changes.
| Automation pattern | Factor range | What it means | Example zone |
|---|---|---|---|
| Always on schedule | 0.90 to 1.00 | Rarely turns off early | Porch dusk-to-dawn |
| Room scene | 0.55 to 0.80 | Scene is used most evenings | Living room, kitchen |
| Motion controlled | 0.20 to 0.45 | Short bursts inside a larger window | Hall, pantry, garage |
| Night guidance | 0.08 to 0.20 | Low level and intermittent | Stair path, kids room |
Beyond its impact on energy consumption in the home, smart lighting creates a specific type of energy use, standby power. While smart lighting bulb use very little power when the lights are turned on, the smart lighting systems themselves use a small amount of power even when the lights are turned off. The energy that the lights use while they are off accumulates over time.
Thus, because smart lighting systems constantly draw standby power, the scheduling of those lights becomes important to energy consumption by those smart lighting systems. The savings that smart lighting technologies provide actualy depend upon how the smart lighting is used, not the type of bulbs that are used in the lighting systems. Standby power is influenced by several different variable.
Why Smart Lights Use Power When Turned Off
Variables to consider include the number of hours that the lights are on, the brightness of the lights, and the amount of time that the lights are active. For instance, a porch light that is scheduled to come on at dusk and to go off at dawn may be active for eleven hours during the course of the night. However, motion sensors may cause the porch light to turn off prior to dawn.
Additionally, lights in a living room may be scheduled to be active for four hours, but the living room lights may be only required to be at full brightness for a portion of those four hours. These variables impact energy use more than the type of light bulb that are used in the lights. Dimming technology allows for the reduction in the use of energy by the lights without the need to remove the light from a fixture.
If the lights are run at eighty percent brightness instead of being at one hundred percent brightness, the lights will consume less energy. Additionally, eighty percent brightness may be felt in the same way as one hundred percent brightness. Additionally, if the lights in a hallway are only thirty percent occupied during a given period of time, the lights will be off seventy percent of the time.
Calculators allow for the entry of these percentage. Thus, the entry of these percentages into the energy use calculator can eliminate the need to guess at how often the lights will be used. Standby power is another aspect of smart lighting that many individual tend to overlook.
To control the smart lights, the smart bulbs must maintain an active radio signal. This active radio signal creates a standby power use of the smart bulbs even when the lights are off. While the standby power used by a single smart bulb is small in relation to the energy bills for the home, the standby power of many smart bulbs can become a large portion of the energy bill for the house.
A tool is available on this page that can separate the energy used by the lights while they are active versus the standby power that is used by the smart lights while they are off. This separation of energy use variables allows for an understanding of the difference between the energy used by the smart lighting schedule versus that which is used by the smart bulbs. The number of light fixtures in a home may appear to be a variable that can influence the energy calculations that are performed for those lights.
Yet, many individuals make mistakes in counting the number of light fixtures in there homes. Instead of counting the number of rooms in their homes, individuals should count the number of actual light fixtures in their homes. For instance, a kitchen may have six recessed fixtures in the ceiling, but a living room may have three lamps.
Each of these light fixtures may have a different energy use. The calculator allows for the entry of the actual number of light fixtures in the home. Additionally, the energy calculations may be adjusted according to other variables in the home.
Seasonal variation may impact the energy use of the lights. The length of the night differs throughout the year. During the winter months, the nights are longer than during the summer months.
Thus, outdoor lights scheduled to run from dusk until dawn may run for twelve or thirteen hours during the winter, but only for eight hours in the summer. Thus, if energy calculations are performed with the same brightness and occupancy settings throughout the year, the energy used will differ between winter and summer months. Therefore, energy calculations should of been performed for both a winter and summer month to provide a clear picture of the energy use of smart lighting throughout the year.
Most individuals that use smart lighting systems dont change the settings for the lights. Thus, an error in the calculation of energy use may occur if individuals do not adjust for changes in the brightness of the lights in the home. For instance, if individuals set a bedroom light to fade to twenty percent brightness after half of the sleeping period, they should use a weighted average to calculate the brightness of the light.
Additionally, if kitchen lights are to fade between task and ambient lighting, a weighted average should be utilized. By utilizing a weighted average, the energy use calculations will not be too high for the individuals energy bill. One of the most common errors in using energy use calculators is the failure to differentiate between rated watts for the bulbs and the measured watts that are used by the lights.
Bulbs that emit colored light may draw more watts when emitting a full white light than those watts that are rated for the bulbs. Additionally, the integrated fixtures for the lamps may not have the same efficiency as other fixtures. The uncertainty regarding wattage can be eliminated by measuring the watts of a single fixture.
If that measured wattage is entered into the calculators, the individuals in the home will provide the most accurate estimate of energy use for the smart lights. The goal in the use of these energy use calculators is not to eliminate every kilowatt-hour of energy that is used by the lights in a home. Instead, the goal is to understand which variables in the smart lighting system are flexible and which variables is fixed.
For instance, a security floodlight may require full brightness for several hours each night. Thus, the energy that is used by that fixture will always be greater than that used by a path light that may only require twenty-five percent brightness. The energy use calculator on this page can perform such calculations.
By understanding which variables influence the energy that is used by smart lights, the individual can easily evaluate the costs of which. Thus, these calculators allow individuals to develop an understanding of how small changes in the brightness or hours of operation for the lights can impact the energy bill. An awareness of these differences allows individuals to find savings on there energy bills.