AQI Calculator
Convert smart home air sensor readings into EPA-style AQI values for PM2.5, PM10, ozone, carbon monoxide, nitrogen dioxide, and sulfur dioxide.
1.Real air quality presets
2.Sensor readings
AQI result
3.Sensor and AQI specs
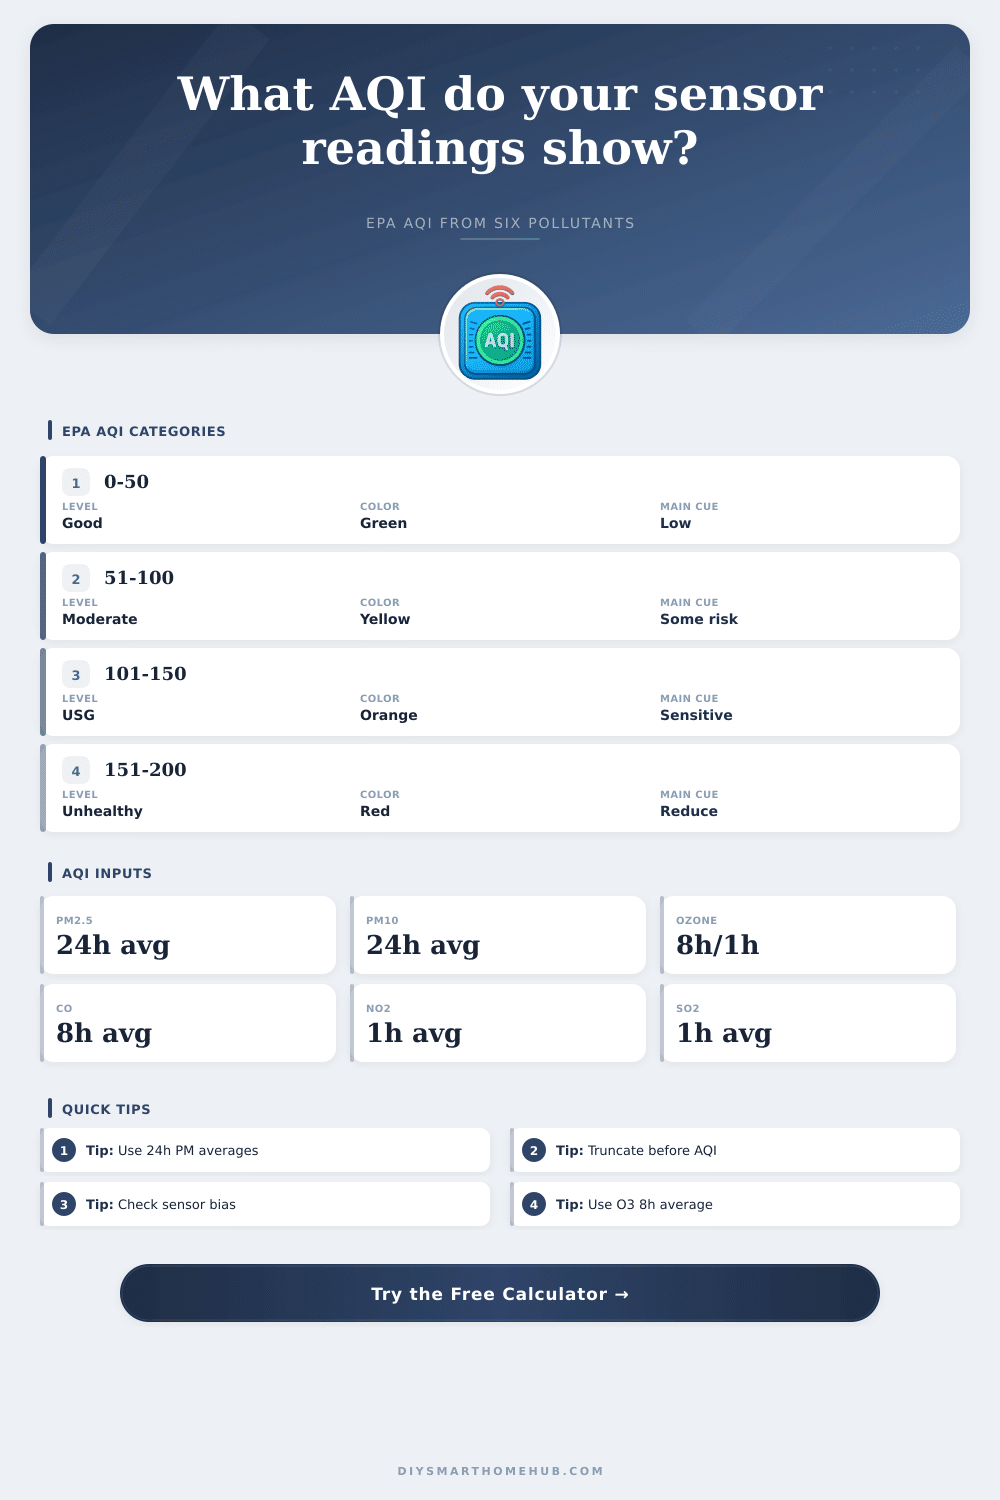
4.EPA AQI category table
| AQI range | Category | Color name | Calculator meaning |
|---|---|---|---|
| 0-50 | Good | Green | Lowest reported AQI tier. |
| 51-100 | Moderate | Yellow | Some unusually sensitive people may notice effects. |
| 101-150 | Unhealthy for Sensitive Groups | Orange | Sensitive groups are the main concern. |
| 151-200 | Unhealthy | Red | Broader public health concern begins. |
| 201-300 | Very Unhealthy | Purple | Health alert level. |
| 301-500 | Hazardous | Maroon | Emergency conditions tier. |
5.EPA breakpoint reference
| Pollutant | Average | Good | Moderate | USG | Unhealthy | Very unhealthy | Hazardous |
|---|---|---|---|---|---|---|---|
| PM2.5 ug/m3 | 24 hr | 0.0-9.0 | 9.1-35.4 | 35.5-55.4 | 55.5-125.4 | 125.5-225.4 | 225.5-325.4 |
| PM10 ug/m3 | 24 hr | 0-54 | 55-154 | 155-254 | 255-354 | 355-424 | 425-604 |
| O3 ppm | 8 hr | 0.000-0.054 | 0.055-0.070 | 0.071-0.085 | 0.086-0.105 | 0.106-0.200 | Use 1 hr |
| CO ppm | 8 hr | 0.0-4.4 | 4.5-9.4 | 9.5-12.4 | 12.5-15.4 | 15.5-30.4 | 30.5-50.4 |
| NO2 ppb | 1 hr | 0-53 | 54-100 | 101-360 | 361-649 | 650-1249 | 1250-2049 |
| SO2 ppb | 1 hr | 0-35 | 36-75 | 76-185 | 186-304 | 305+ caps at 200 | 24 hr needed |
6.Sensor/spec comparison grid
| Sensor channel | Common module type | Useful range | AQI caution |
|---|---|---|---|
| PM2.5 / PM10 | Laser particle counter | 0-1000 ug/m3 | Humidity and particle mix can bias readings. |
| Ozone O3 | Electrochemical or UV | 0-1 ppm | Use 8-hour averages for most AQI reporting. |
| CO | Electrochemical | 0-500 ppm | Safety alarms use different logic than AQI. |
| NO2 | Electrochemical | 0-20 ppm | Cross-sensitivity can be significant indoors. |
| SO2 | Electrochemical | 0-20 ppm | Low ppb accuracy depends heavily on calibration. |
| VOC / CO2 | MOS or NDIR | Module-specific | Not part of the EPA AQI formula. |
7.Averaging and truncation table
| Pollutant | Input unit | EPA averaging basis | Truncation before AQI |
|---|---|---|---|
| PM2.5 | ug/m3 | 24-hour average | 1 decimal place |
| PM10 | ug/m3 | 24-hour average | Integer ug/m3 |
| O3 | ppm | 8-hour and sometimes 1-hour | 3 decimal places |
| CO | ppm | 8-hour average | 1 decimal place |
| NO2 | ppb | 1-hour average | Integer ppb |
| SO2 | ppb | 1-hour through AQI 200 | Integer ppb |
Air quality measurement are only useful if you understand what the measurements mean for the people breathing the air. A raw measurement from an air quality sensor will tell you the air quality measurement for a given area; however, the raw numbers from the sensor will not tell you whether the air quality measurements is routine measurements or whether they necessitate a change in the air quality in that area through a change in ventilation, for example. The Air Quality Index (AQI) calculation can help to answer these questions.
To calculate the AQI, the air quality sensor must first measure the specific pollutant in the air. Different pollutants creates different health effects on humans, and different pollutants require different averaging period for those measurements. For example, fine particles and coarse particles must be averaged over a 24-hour period to reflect their long-term effect on humans.
How the AQI Works
In contrast, ozone measurements can be taken over an eight-hour period, though in cases where the ozone concentration in the air is very highly, those measurements can be taken over a one-hour period. Similarly, gas pollutant like carbon monoxide, nitrogen dioxide, and sulfur dioxide also have different measurement periods that must be accounted for in the AQI calculation. The AQI calculator software account for these different averaging periods, so that sensors dont have to manually adjust air quality measurement values to account for each pollutant’s different required averaging periods.
After determining the specific pollutant being measured, the AQI applies its own method to calculate the AQI from the measurement. The Environmental Protection Agency (EPA) method for calculating the AQI first truncates the raw sensor measurement value according to the rules for that specific pollutant. Following truncation, the value is placed into one of six breakpoint range.
Within each of these ranges, the raw measurement is interpolated to create a sub-index value. Each pollutant will have a sub-index value, and the AQI is the highest sub-index value. Because the AQI is the highest sub-index value, one pollutant can impact the AQI even if other pollutants is within the moderate range for that pollutant.
Thus, the AQI can indicate which pollutant is most impacting the air quality, indicating whether windows should be opened or an air cleaner introduced. The values from sensors can drift from there actual values due to a variety of variables. For instance, low-cost sensors can drift due to humidity in the area, the temperature in the area, or the age of the sensor.
Sensors that detect particles in the air may return high readings if they are located near a kitchen, for instance. Outdoor sensors may exhibit high reading if they are located on a busy street. These sensors can be adjusted with the bias adjustment tool in the AQI measurement software; however, the accuracy of the adjustment is only as accurate as the evidence used to adjust the sensor.
Users often compare the raw measurements from their sensor to those from a trusted outdoor monitoring station over a period of one or two week. Specific scenario within the home may expose the inhabitants to specific pollutants. For instance, cooking with gas will expose inhabitants to both particles and nitrogen dioxide.
Each of these measurements can impact the AQI reading for the home. Similarly, pollutants in a garage with an idling car can contribute to AQI measurements of carbon monoxide and nitrogen dioxide level in the area. Wildfire smoke contains a high level of fine particle, or PM2.5, which will contribute to the PM2.5 channel in the AQI.
Thus, identifying which pollutants contribute to the AQI allows inhabitants to treat that specific pollutant rather than applying a one-size-fits-all solution to all high AQI measurement in the home. The AQI also provide different categories of air quality. The air quality categories provide meaning to the AQI measurement.
For instance, good air quality does not require any special action by the individuals in the area. Moderate air quality may affect individuals that are sensitive to air pollution, but most individuals will not experience any effects from the air quality at a moderate level. Unhealthy air quality for sensitive groups may require that individuals that are sensitive to air pollution limit their outdoor exertion.
Higher level of unhealthy air quality impact more individuals with recommendations for various actions. These tables make up the result of the AQI calculator in addition to the AQI measurement itself. The AQI does not measure each type of air contaminant.
Sensors often detect two of the most common air contaminant: volatile organic compounds (VOCs) and carbon dioxide (CO2). However, the EPA does not account for these two pollutants in the AQI formula. High levels of VOCs can lead to irritation of the eyes, nose, and throat. High levels of CO2 in indoor spaces may indicate poor air quality and a need for increased ventilation.
However, neither of these pollutant contribute to the AQI value. Different pollutants use different averaging period for their measurements. For instance, as discussed, ozone measurements may be averaged over an eight-hour time period.
However, a very high concentration of ozone may be measured over a one-hour time period. Similarly, fine particles and coarse particles are averaged over a 24-hour period. Thus, depending upon the pollutant being measured, the measurement periods may impact the AQI.
For example, the one-hour average for ozone can be entered into the AQI measurement calculator in place of the eight-hour average for ozone measurements to determine if entering the shorter time period impact the AQI. The value of the AQI is that it turns raw sensor measurements into an understandable and actionable figure. Once the sensor measurements determine the AQI, the driving pollutant, and the AQI category, the air quality can be compared across different area within the home.
Each of these reference table provide the breakpoints for each pollutant at each AQI level. These tables allow individuals to understand the AQI measurement and it’s implication for the inhabitants of the area being measured.