⚡ SEER Rating Comparison Calculator
Compare two AC systems by SEER rating — calculate annual kWh, energy savings, and runtime costs side by side.
Quick Presets
System Inputs
Annual Energy Usage Comparison
Detailed Results
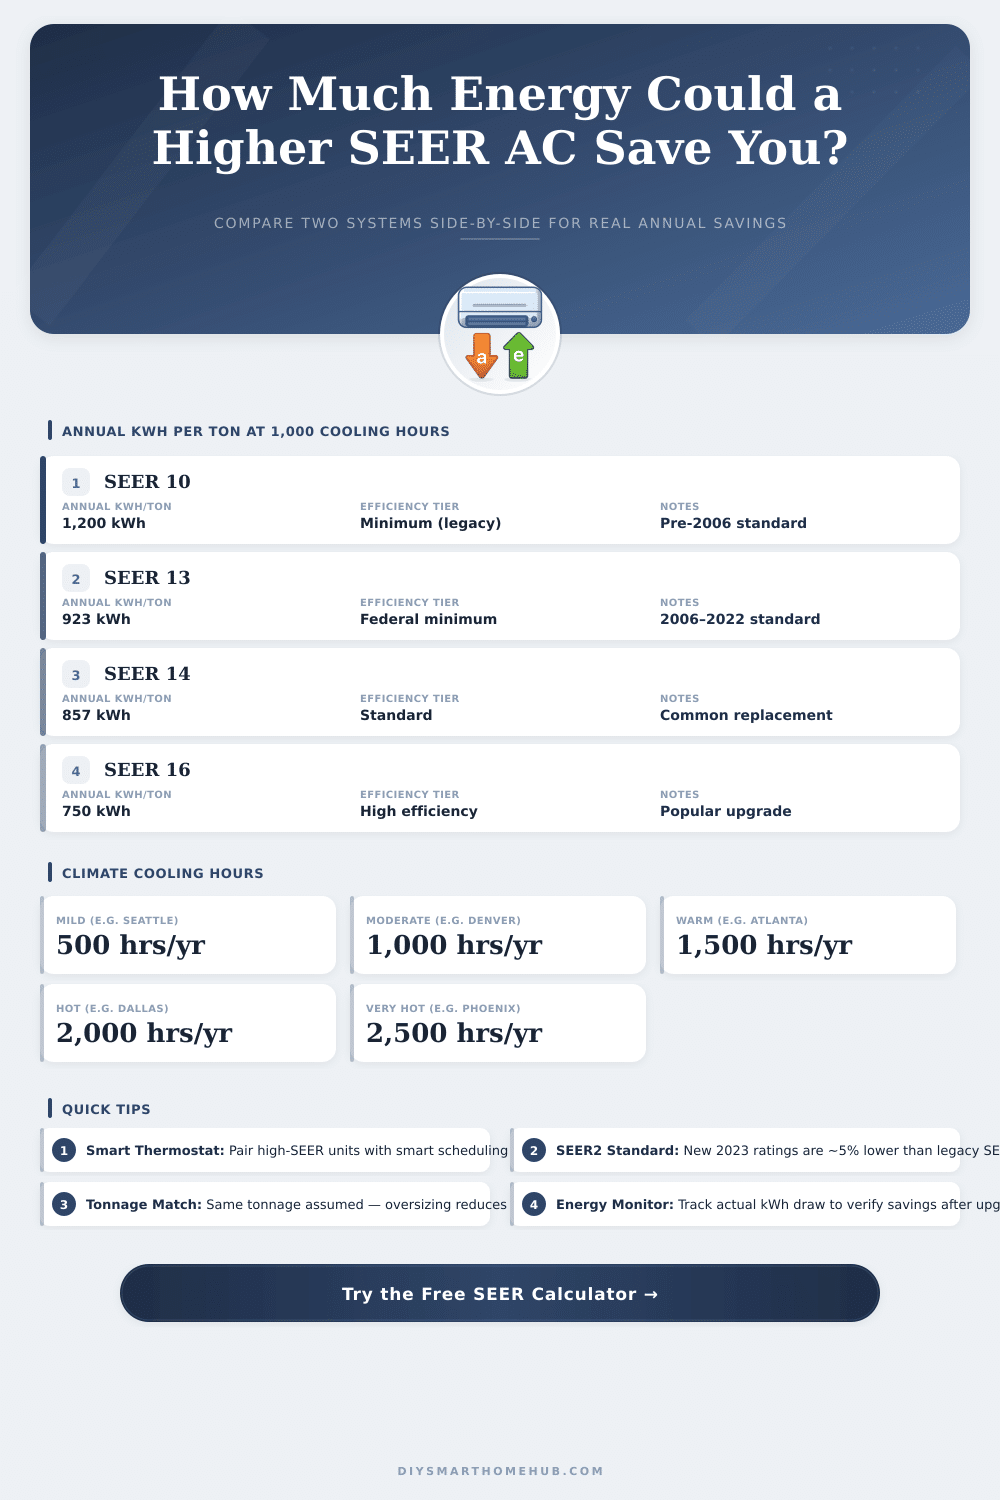
SEER Spec Grid — Annual kWh per Ton at 1,000 Hours
Formula: kWh/ton = (1 ton × 12,000 BTU × 1,000 hrs) ÷ (SEER × 1,000)
SEER Rating Reference Table
| SEER Rating | EER Equiv. | Annual kWh/Ton (1000 hrs) | Efficiency Tier | Notes |
|---|---|---|---|---|
| 10 | ~8.0 | 1,200 | Legacy | Pre-2006, often replaced |
| 13 | ~10.5 | 923 | Standard | 2006–2022 federal minimum |
| 14 | ~11.2 | 857 | Standard | Common replacement unit |
| 15 | ~12.0 | 800 | Standard | Entry high-efficiency |
| 16 | ~13.0 | 750 | High Efficiency | Popular upgrade tier |
| 18 | ~14.5 | 667 | High Efficiency | Energy Star certified |
| 20 | ~16.0 | 600 | High Efficiency | Premium — low running cost |
| 22 | ~17.5 | 545 | Ultra Premium | Top residential tier |
| 24 | ~19.0 | 500 | Ultra Premium | Smart-ready systems |
| 26 | ~21.0 | 462 | Ultra Premium | Variable-speed inverter |
EER equivalents are approximate. SEER2 (2023+) values are approximately SEER × 0.95.
Climate Zone Cooling Hours Guide
| Climate Zone | Typical Cooling Hrs/Yr | Example Cities | Recommended SEER |
|---|---|---|---|
| Mild / Cool | 400–600 | Seattle, Portland, San Francisco | SEER 13–15 |
| Mixed / Moderate | 700–1,200 | Denver, Chicago, Kansas City | SEER 14–16 |
| Warm / Humid | 1,200–1,800 | Atlanta, Charlotte, Nashville | SEER 16–18 |
| Hot / Dry | 1,800–2,200 | Las Vegas, Dallas, Tucson | SEER 18–20 |
| Very Hot / Humid | 2,000–2,600 | Phoenix, Miami, Houston | SEER 20–24 |
Cooling hours are annual estimates for sizing reference. Actual runtime varies by thermostat setpoint, insulation, and building envelope.
A higher SEER rating only delivers full savings when the system runs at optimal conditions. Pairing a high-SEER unit with a smart thermostat — especially one with occupancy sensing and weather-adaptive scheduling — can close the gap between rated SEER and real-world performance. Pre-cooling during off-peak rate hours and avoiding short-cycling are key scheduling strategies.
Smart home hubs can also monitor runtime hours directly, letting you track actual cooling season usage versus estimated hours. If your actual hours are significantly higher than the climate zone estimate, recalculating with your real runtime gives a more accurate annual kWh figure.
The SEER2 standard introduced in 2023 uses slightly different test conditions than legacy SEER, resulting in ratings approximately 5% lower for the same physical unit. When comparing a pre-2023 unit (SEER) to a new unit (SEER2), be aware the standards differ — a SEER2 20 unit is roughly equivalent to a legacy SEER 21 unit in real-world performance.
A whole-home energy monitor or a dedicated circuit-level smart plug can measure the actual kWh draw of your AC compressor over a season. Comparing this real measurement to the calculated estimate tells you whether your system is performing at its rated SEER or underperforming due to refrigerant issues, dirty coils, or oversized ductwork.
The SEER rating (or Seasonal Energy Efficiency Ratio) measures how well an air conditioning system cools. It is a standard to estimate and compare the energy efficiency of different devices. SEER is calculated by dividing the total cooling output by the energy consumed; so higher the number, the better the efficiency.
With a higher SEER rating, the unit uses less energy and costs to operate are lower
SEER and SEER2: What They Mean for Air Conditioners
Today, SEER ratings for air conditioners and heat pumps usually range between 13 and 24, where the highest figures show the most efficient models. Modern devices can range from 14 until even 28 SEER. In the United States, the lowest rating you can install is 13 SEER.
For most systems, a good rating is between 14 and 16 SEER; higher models offer a bit more efficiency, but cost a bit more money. The best SEER value genuinely depends on your locatoni and what you use for warming and cooling.
For instance, 16 SEER could save about 20% of the energy costs, although it costs around 10% more than 13 SEER. Mini split systems and other inverter controlled devices usually operate between 18 and 21 SEER. A unit with 18 SEER is likely around 25% more efficient than one with 13 SEER.
While the jump from 8 to 10 SEER was a big difference, moving from 18 to 20 now is barely noticed.
Now we talk about SEER2. This new standard (Seasonal Energy Efficiency Ratio 2) offers a more precise way to estimate the efficiency of HVAC systems. SEER2 considers various factors that you before ignored.
Because of a change in the exterior static pressure during the test (from 0.5 inches down to 0.1 inches), the result is more precise. That means that SEER2 ratings will be lower than the old SEER ratings for the same device. A system with a SEER2 rating is indeed 4.71% more efficient than a SEER system with the same number.
Models produced before 2023 are still marked with the old SEER rating, but those from 2023 and later are marked with SEER2. This caused a bit of confusion among homeowners. Initially, SEER2 systems could have a bit higher price because of the improved technology and more strict testing.
Devices with a higher SEER rating commonly have a variable speed compressor, that cools better. Two stage or variable speed units operate longer with less power, which gives better comfort. Even so, the higher the SEER rating, the more expensive can be the repairs.
The decision depends on local energy costs, service rates, the climate zone, the existing ductwork and the wanted efficiency. A free calculator for SEER savings can help you quickly see how much energy you will save if you upgrade to a more efficient SEER2device.