Fiber Optic Latency Calculator
Estimate fiber one-way delay and round-trip latency from route length, refractive index, propagation speed, optical equipment hops, frame serialization, endpoint processing, and link bitrate.
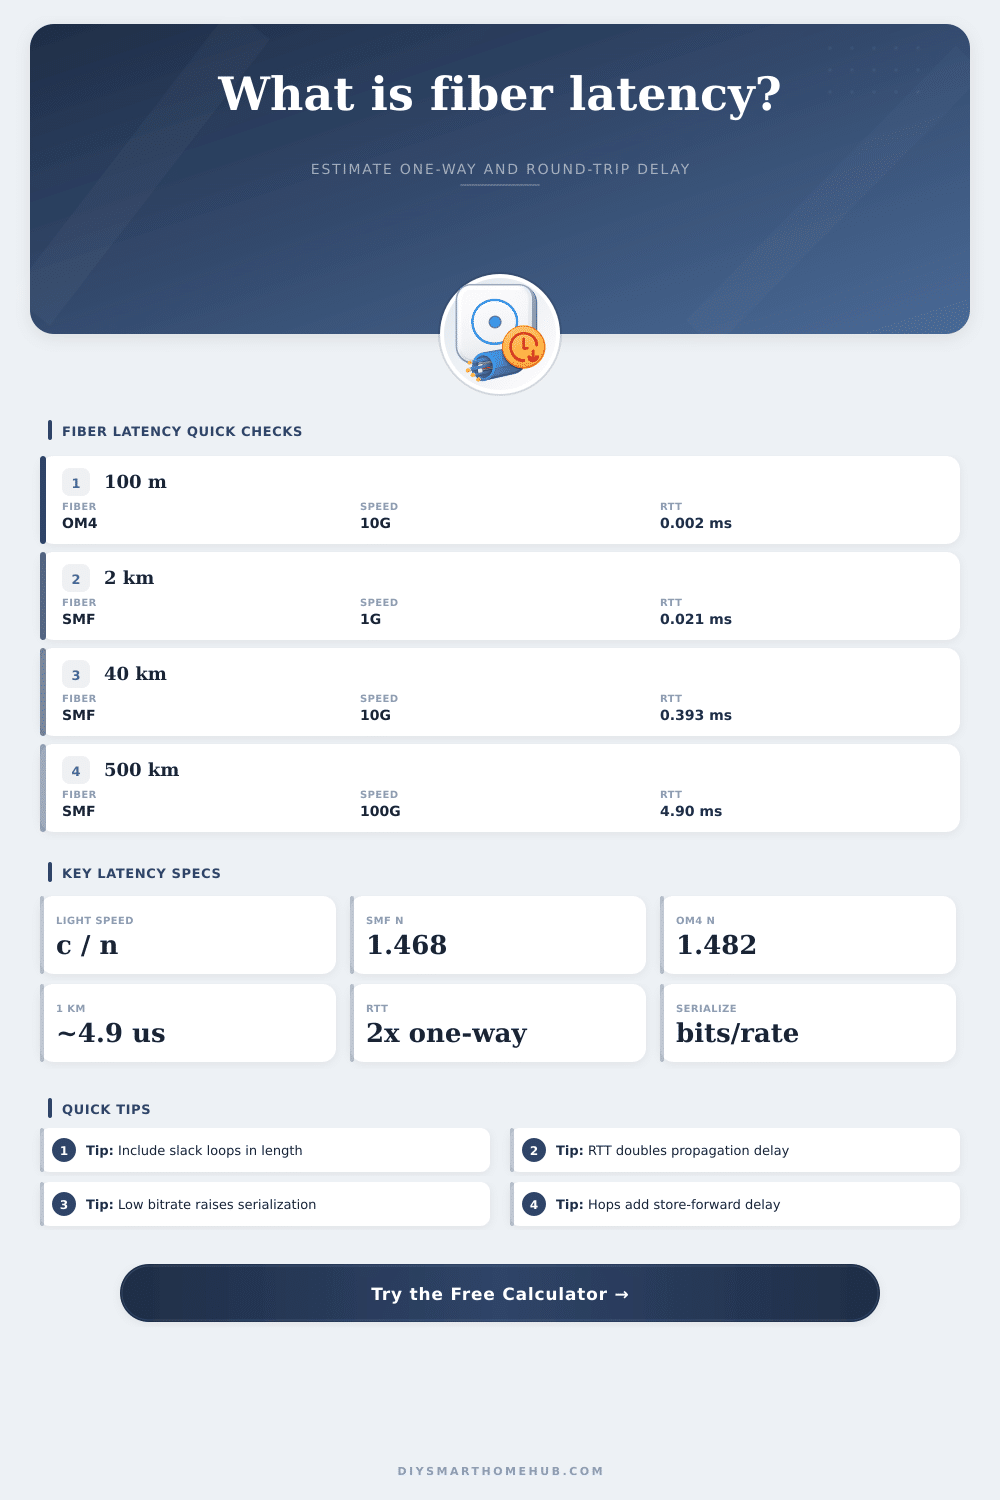
📌Fiber latency presets
⚙Latency inputs
💡Live fiber model
📊Current fiber and network spec grid
📋Fiber propagation reference
| Fiber medium | Typical refractive index | Speed in fiber | One-way delay | Best use in the calculator |
|---|---|---|---|---|
| OS2 / standard single-mode | 1.4682 | About 204,190 km/s | About 4.90 us/km | Default for campus, metro, FTTH, and carrier SMF links. |
| Low-latency single-mode | 1.4670 | About 204,357 km/s | About 4.89 us/km | Use when the glass index is specified for latency-sensitive routes. |
| OM3 / OM4 multimode | 1.4820 | About 202,289 km/s | About 4.94 us/km | Use for short data-center, rack, and campus multimode paths. |
| Bend-insensitive SMF | 1.4690 | About 204,079 km/s | About 4.90 us/km | Use when drop cable or indoor bend-insensitive fiber is in the path. |
| Hollow-core estimate | 1.0030 | About 298,896 km/s | About 3.35 us/km | Use only for special hollow-core estimates, not normal glass fiber. |
🖧Equipment and network delay comparison
| Network element | Typical added delay | Where it appears | Latency behavior | Calculator setting |
|---|---|---|---|---|
| Cut-through switch | 0.3 to 1 us | Low-latency Ethernet switching | Begins forwarding before full frame receipt. | Use 0.4 us per hop. |
| Store-forward switch | 3 to 10 us | Common managed access and aggregation switches | Receives and checks the frame before forwarding. | Use 5 us per hop. |
| Layer-3 router | 10 to 100 us | Routing, firewall, NAT, or policy edges | Lookup, buffering, and features can dominate short links. | Use 25 us or custom. |
| PON access stage | 100 to 1000 us | OLT, splitter, and ONU access networks | Scheduling and access framing can add more than fiber distance. | Use 250 us or custom. |
| Coherent transponder | 0.5 to 2 ms | Metro, regional, and long-haul optical transport | DSP and FEC can exceed pure propagation on short spans. | Use 1000 us or custom. |
📝Example route sizes
| Route profile | Fiber length | Likely medium | Pure RTT from fiber | What usually matters next |
|---|---|---|---|---|
| Rack or room patch | 10 to 100 m | OM3, OM4, or SMF | 0.0001 to 0.001 ms | Switching and serialization dominate. |
| Campus building link | 0.5 to 2 km | OM4 or OS2 | 0.005 to 0.020 ms | Patch slack and equipment count matter. |
| FTTH access loop | 2 to 20 km | OS2 / bend-insensitive | 0.02 to 0.20 ms | PON scheduling often dominates. |
| Metro ring path | 20 to 80 km | OS2 single-mode | 0.20 to 0.78 ms | Route meander and optical devices matter. |
| Regional transport | 100 to 500 km | OS2 plus amplifiers | 0.98 to 4.90 ms | Fiber route length dominates unless coherent DSP is heavy. |
| Subsea or long-haul | 1000 km or more | Long-haul single-mode | 9.8 ms per 1000 km | Propagation dominates the visible RTT floor. |
📐Serialization delay table
| Frame size | 1 Gbps | 10 Gbps | 100 Gbps | Interpretation |
|---|---|---|---|---|
| 64 bytes | 0.512 us | 0.051 us | 0.005 us | Small control packets have very little serialization delay. |
| 512 bytes | 4.096 us | 0.410 us | 0.041 us | Visible at low rates and many store-forward hops. |
| 1518 bytes | 12.144 us | 1.214 us | 0.121 us | Standard Ethernet frames are modest at 10G and above. |
| 9000 bytes | 72.000 us | 7.200 us | 0.720 us | Jumbo frames can matter on 1G or hop-heavy designs. |
💡Fiber latency tips
Fiber latency can cause problem for networks where high availability and low latency are require. The latency that occurs for fiber optic cable is due to the signal travelling through the glass of the fiber optic cables at a slower rate than the speed of light. The latency for every kilometer of fiber optic cable is small, but the further the data signal have to go across a network, the more higher the latency that will be experienced.
The latency for fiber optic cables is important in networks where even a few milliseconds difference in latency can be the difference between a trade being executed or a video streaming service buffer. The speed of the signal through the fiber optic cable is dependent upon the refractive index of the glass of the fiber optic cable. The refractive index for standard single mode fiber optic cables is approximately 1.468, which means that the speed of light through the fiber is approximately 2/3 the speed of light in a vacuum.
What Causes Delay in Fiber Optic Networks
Multimode fiber optics is used within buildings and have a slightly slower rate of propagation for data signals than single mode fiber optics. Hollow core fiber optics technologies aim to create fiber optics where the refractive index is closer to 1, allowing light to travel closer to the speed of light in a vacuum. However, hollow core fiber optics are still relatively rare.
Since the refractive index of the fiber optic cable does not change with distance, you can calculate the latency of the fiber optic cable based off the type of fiber optic cable. All other latency will be added to this calculation. The routes of fiber optics are rarely laid out in perfectly straight lines.
Furthermore, the fiber optic cable often has to take turns around corners in buildings, and the fiber optic cable often has to go through cabinets where service providers lay there equipment. Additionally, there are slack loops at the splices of the fiber optics where technicians may need to make adjustments to the fiber optics. Additionally, there are also service coils that are installed around corners.
There is typically a three percent to five percent allowance for the length of fiber optics to be laid out in these situations. Thus, a distance of two kilometers may become 2.1 kilometer of actual fiber optics. This adjustment for slack is accounted for in the fiber optic latency calculator.
The calculator allow users to input the length of the route in kilometers, the percentage of slack to add to the route, and it calculates the propagation number for that route. Network equipment will also add to the latency of the fiber optic cable. Cut through switches can begin to forward data packets before the entire packet has entered the switch.
Cut through switches can only introduce delays of a few hundred nanoseconds. Store and forward switches will introduce delays of low microseconds as they must wait for the entire data packet to enter the switch. Furthermore, data routers will typically introduce additional latency to the network than switches do.
Equipment delays can be higher than fiber latency for small networks and links. For instance, a five kilometer link may take longer than a fifty kilometer link with only two network hop. Serialization will add to the latency of the network if the rate of the line is low or if the size of the data frame is large.
At a data rate of one gigabit, it can take more than twelve microseconds for a 1500 byte data packet to exit the port. At a rate of one hundred gigabits, the same data packet takes only a fraction of a microsecond to exit the port. The calculator accounts for frame size and line rate, and multiplies that value by the number of store and forward switches in the network.
Thus, serialization delays are factored into the total latency calculation. The round trip time for data is the one way time delay times two. Thus, it takes twice as long for a data packet to travel to the destination and for the reply to travel back to the originating device.
Most network monitoring tools will report the round trip time. However, it is beneficial to view the one way time delays to find the source of latency. If the propagation delays account for the majority of the latency for the network, then the solution is to reduce the length of the route or change the type of fiber optics.
However, if the majority of the delay is from the network equipment or serialization, then changes to the network will require the use of fewer network hops or faster network ports. The difference between these various forms of latency becomes critical when comparing two different networks. For instance, a regional backhaul network link may experience four milliseconds of fiber latency, but the use of coherent transponders at each end of the link can add two additional milliseconds of digital signal processing latency.
Furthermore, a link between two data centers might experience the same total latency but over a shorter distance of fiber optics. In both of these situations, if the latency for each of the components of the network link was not separate, it would appear that both links have the same latency with a latency calculator. The latency calculator is constructed in a way that allows the different components of network latency to remain visible for the user.
For instance, the users can easily make changes to the type of fiber optics, the number of network hops, or the line rate. Each of these changes can be viewed in how they alter the latency of the network. Thus, the latency calculator allow for a single number to become several different factors that relate to and can be adjusted during the planning of the network.