Dew Point Calculator
Estimate dew point, actual vapor pressure, humidity ratio, and surface condensation risk from temperature, relative humidity, barometric pressure, sensor accuracy, and the surface you are monitoring.
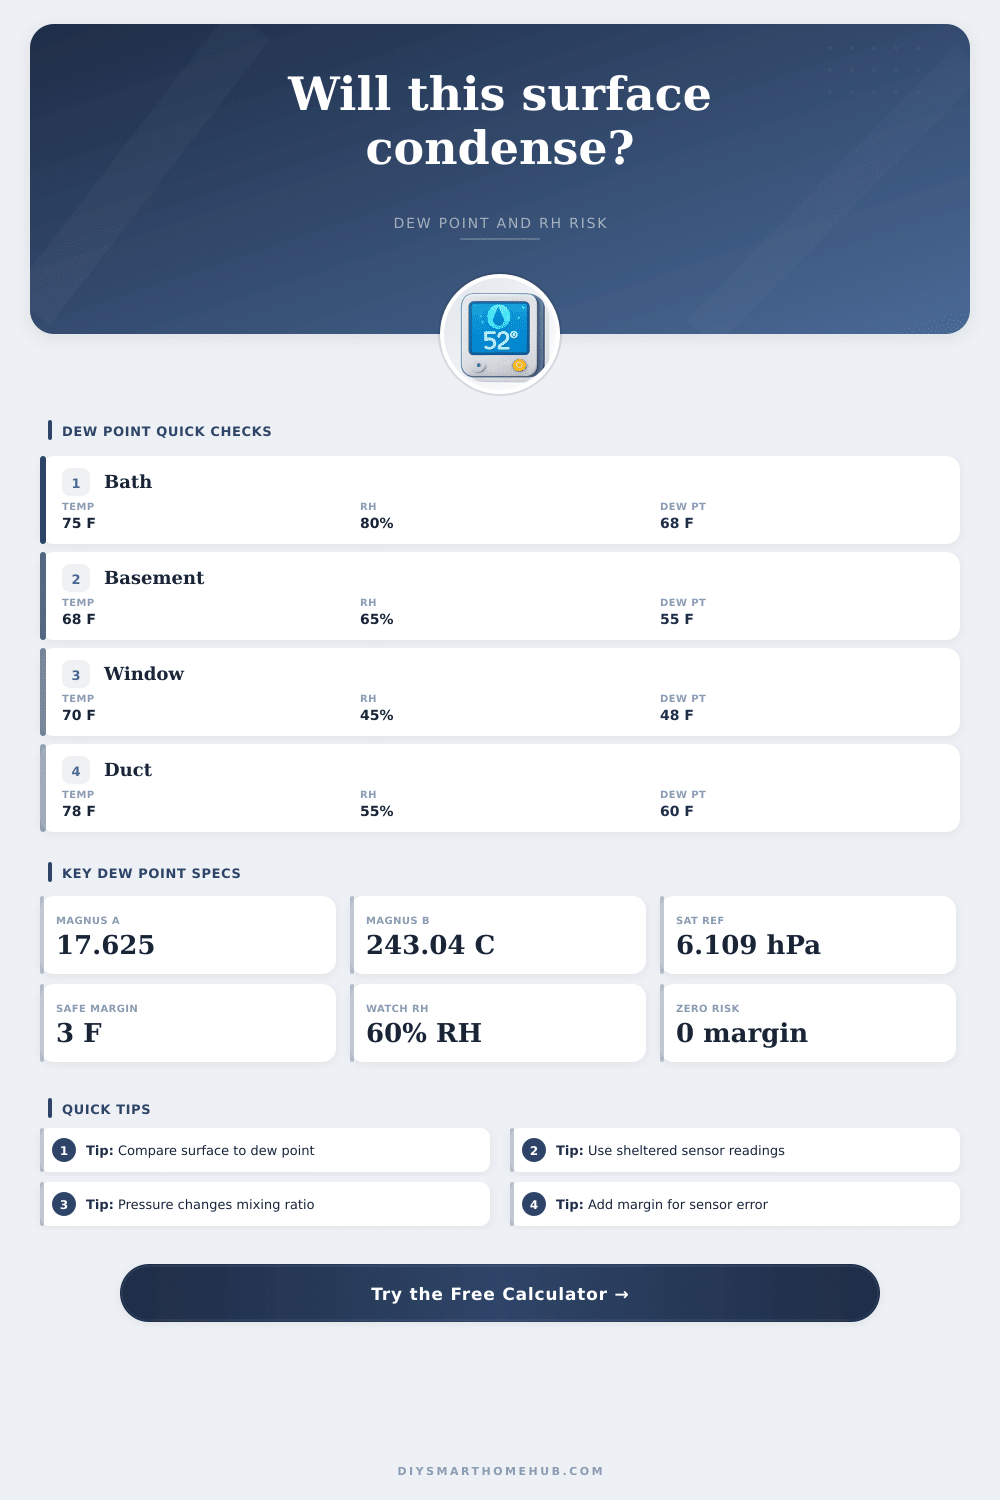
🎯Smart Home Dew Point Presets
⚙Dew Point Inputs
📊Current Moisture And Risk Snapshot
📘Dew Point And Condensation Reference Tables
| Indoor condition | Air temperature | Relative humidity | Approx. dew point | Smart home use |
|---|---|---|---|---|
| Dry winter room | 70 F / 21.1 C | 30% | 37 F / 2.8 C | Low window condensation risk |
| Comfortable room | 72 F / 22.2 C | 45% | 49 F / 9.3 C | Good baseline for living spaces |
| Humid basement | 68 F / 20.0 C | 65% | 55 F / 12.8 C | Watch cold walls and slab edges |
| Bathroom spike | 75 F / 23.9 C | 80% | 68 F / 20.4 C | Mirrors and glass can fog quickly |
| Grow or plant room | 78 F / 25.6 C | 70% | 67 F / 19.5 C | Cold ducts and tent walls need margin |
| Hot attic air | 95 F / 35.0 C | 55% | 76 F / 24.5 C | Supply duct sweating becomes likely |
| Surface margin | Risk label | What it means | Sensor alert setting | Common surface |
|---|---|---|---|---|
| Below dew point | Condensing | Water can form on the surface now | Immediate alert | Glass, metal duct, pipe |
| 0 to 2 F / 0 to 1.1 C | Very close | Small sensor error can flip the result | High priority alert | Cold window edge |
| 2 to 5 F / 1.1 to 2.8 C | Watch | Useful range for automation warnings | Warning threshold | Slab or exterior corner |
| 5 to 10 F / 2.8 to 5.6 C | Guarded | Normally safe unless readings drift | Trend monitor | Drywall, trim, cabinet |
| Above 10 F / above 5.6 C | Low | Surface is comfortably above dew point | No alert | Warm interior surfaces |
| Pressure condition | Pressure | Same vapor pressure | Humidity ratio effect | Why it matters |
|---|---|---|---|---|
| Sea-level standard | 1013 hPa / 29.92 inHg | Baseline | Baseline g/kg | Normal home reference |
| Storm low | 980 hPa / 28.94 inHg | Dew point unchanged | Slightly higher g/kg | Moisture mass estimate rises |
| High pressure | 1035 hPa / 30.56 inHg | Dew point unchanged | Slightly lower g/kg | Mixing ratio estimate falls |
| High elevation home | 850 hPa / 25.10 inHg | Dew point unchanged | Noticeably higher g/kg | Important for psychrometric logs |
| Pressurized duct | 1020 hPa / 30.12 inHg | Dew point near same | Small g/kg shift | Duct probes may see local pressure |
| Sensor / spec profile | Typical RH accuracy | Typical temp accuracy | Best placement | Condensation watch point |
|---|---|---|---|---|
| Basic smart sensor | +/-3% RH | +/-0.5 C | Open room air | Use extra margin near glass |
| Calibrated room sensor | +/-2% RH | +/-0.3 C | Representative room wall | Good for trend alerts |
| Remote probe sensor | +/-1.5% RH | +/-0.2 C | Near slab, pipe, or duct | Best for surface comparisons |
| Battery corner puck | +/-4% RH | +/-0.7 C | Cabinet or crawlspace | Dead air can overstate risk |
| Duct rated probe | +/-2.5% RH | +/-0.4 C | Air stream or plenum | Lag can miss fast changes |
| Industrial transmitter | +/-1% RH | +/-0.15 C | Critical monitoring point | Strong choice for tight margins |
💡Dew Point Planning Tips
The dew point is the temperature at which air becomes saturated with moisture. The dew point is the temperature at which water vapor turn back into liquid water. The dew point does not depend on the temperature of the specific surface that is being discussed, but the dew point is important in that moisture will collect on that surface if the temperature of the surface is below the dew point.
In relation to each other, those who wish to avoid condensation of water on those surfaces must understand the dew point and the temperature of the surface. Should there be a small gap between the dew point and the surface temperature, small changes or error in either temperature will result in the collection of water on that surface. Relative humidity and air temperature is two of the most common measurements of moisture in the air.
Dew Point and Condensation on Surfaces
However, relative humidity does not always accurately reveal the absolute amount of moisture that is contained in the air. For example, two rooms can have the same relative humidity yet have different amounts of water that can be contained within the air in those rooms if the air temperatures within those rooms are different. Due to this relationship between relative humidity and air temperature, people can make other measurements of humidity, such as the humidity ratio and vapor pressure.
The humidity ratio and the vapor pressure are indicators of the amount of moisture in the air that will remain the same regardless of the change in temperature. Thus, these two measurements can be used to compare the amount of moisture in the air during different season of the year, for example. In addition to temperature, barometric pressure also has an effect upon the amount of moisture that is contained in the air that travels through the air.
The barometric pressure of the air can change in relation to the elevation at which an individual live. For example, an individual that lives in a home that sits on a mountain will experience a different barometric pressure than an individual that lives at sea level. These changes in barometric pressure can change the humidity ratio of the air.
Thus, the impact of barometric pressure is another factor to be consider in individuals who wish to compare the humidity readings of two locations that have different barometric pressures from one another. In addition to the factors discussed above, the accuracy of the sensors that measure the dew point can also impact the accuracy of that measurement. For example, if the sensor is not accurate in measuring the humidity within the air, and if the sensor drifts three percent from the actual relative humidity of the air, the dew point will drift by more than one degree in relation to the actual dew point of the air.
Such a change in the dew point of the air by one degree is another significant factor to consider for individuals that wish to calculate the safety margin for humidity relative to the surface temperatures of various objects. Thus, sensors can also be inaccurately measure, and sensor profiles can be used to adjust the safety margin according to the trust that is to be placed in those sensors that measure the dew point. Finally, the type of surface also has an effect upon the amount of moisture that can interact with that surface.
Because glass quickly reacts to changes in temperature, condensation will form on glass almost immediately if the temperature of the glass drop to the dew point. Conversely, concrete takes longer to adjust to changes in temperature. Therefore, a slab of concrete can continue to remain at a temperature that is below the dew point of the air, even if the air temperatures in the surrounding area have risen.
Wood and drywall are materials that take longer to react to changes in moisture. Therefore, condensation on these materials does not occur immediately, but over a period of time due to continued exposure to moisture. Airflow also plays a crucial role in how the dew point of the air impact the materials within a space.
Air that does not move in the same way as the rest of the air in the area will experience changes in temperature at a slower rate. As a result, the objects in that area will remain cooler than areas where air movement is more common. Therefore, calculations of the impact of the dew point must account for the evenings out of air temperature and surface temperature.
Using the concept of the dew point allow for problems to be recognized before they occur in the environment. For instance, mirrors may become fogged up after showers due to the rapid drop in temperature of the mirror relative to the air in the bathroom. Basements may become damp due to the fact that the concrete maintains high temperatures during the summer months while the air temperatures in the area drop during the fall.
In each case, the calculation of the dew point will indicate the relationship between the two temperatures before moisture becomes a problem in that area. It is actualy more helpful to monitor the trend of the dew point than the dew point value itself. The dew point slowly changes as a reflection of the amount of moisture in the air.
If the trend of the dew point increases while the surface temperature remains the same, the gap between these two temperatures is shrinking. Thus, there is an increased risk of condensation on that surface. There are seasonal changes to the dew point of the air.
During the winter months, outdoor air temperatures have low amounts of moisture in them, leading to low dew points. During the summer months, outdoor air temperatures are warm and contain moisture in the air, leading to higher dew points. Therefore, when outdoor air temperatures and dew points rise, there is an increased chance that air-conditioned surfaces will reach a temperature that falls below the dew point of the surrounding air.
Finally, through the use of a calculator that incorporates these parameters, it is possible to determine whether the temperature of the surface remains above the dew point, or if the gap between those two temperatures presents a potential problem with condensation.