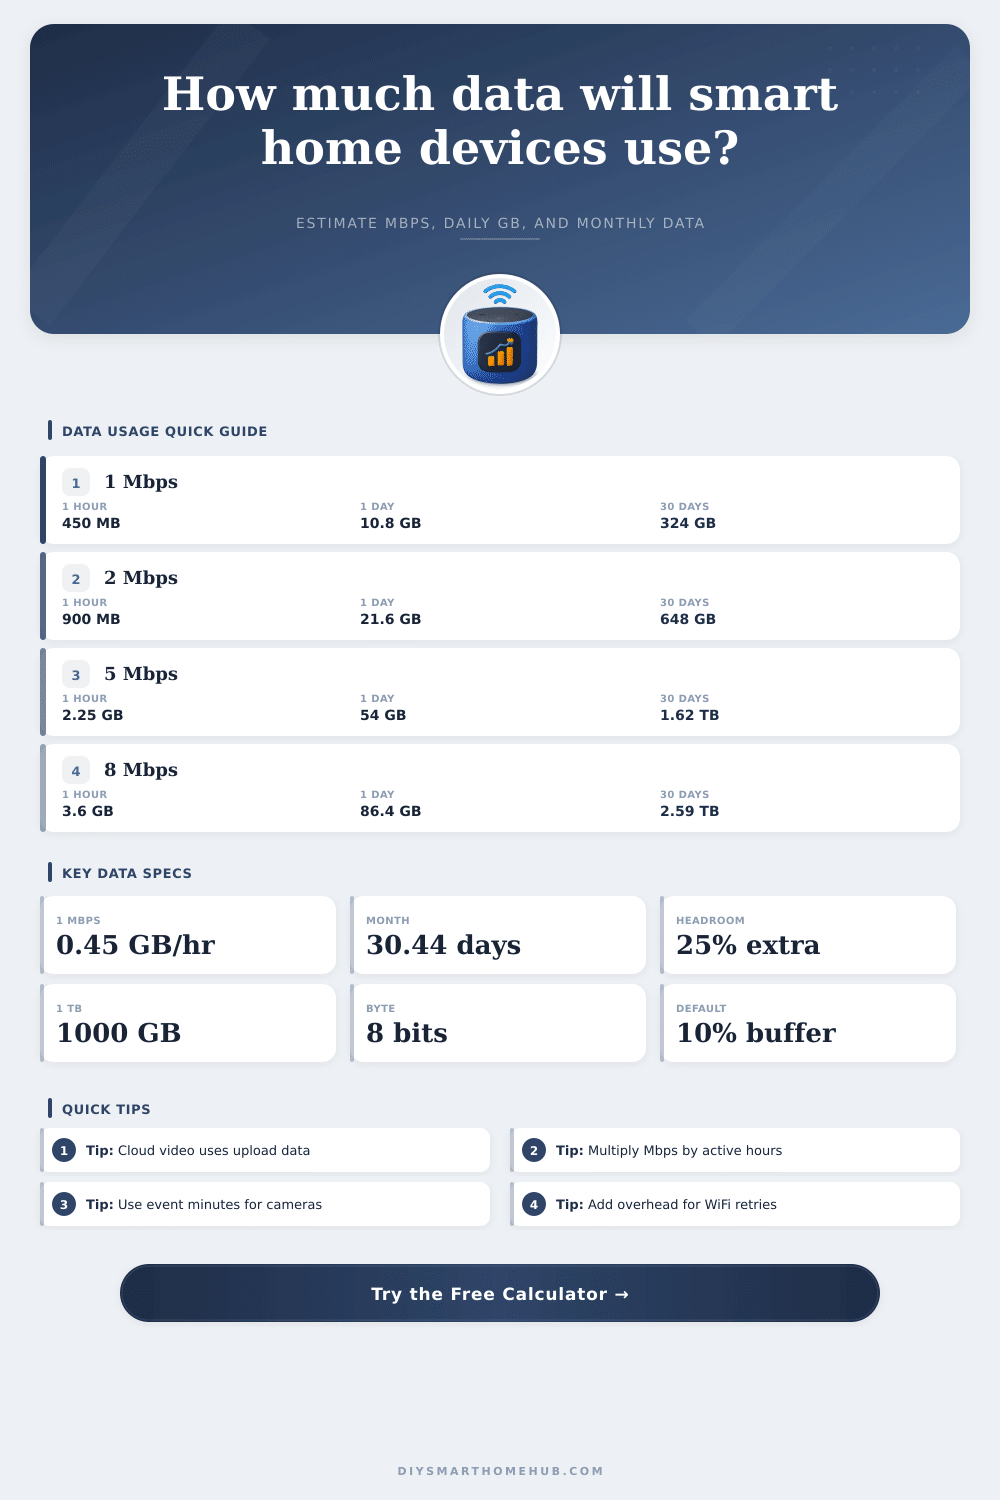
Data Usage Calculator
Estimate daily GB, monthly data, upload Mbps, and network overhead for cloud cameras, smart displays, hubs, speakers, and other connected home devices.
📌Smart Home Presets
📶Usage Inputs
Calculation Breakdown
📊Core Data Conversion Specs
🎥Device Data Rate Reference
| Smart Home Traffic | Typical Planning Rate | 1 Active Hour | Best Use In Calculator |
|---|---|---|---|
| Automation hub telemetry | 0.005 Mbps | 0.002 GB | Always-on sensors, small commands, status checks |
| Smart speaker music | 0.16 Mbps | 0.072 GB | Music, radio, podcasts, and voice responses |
| 720p security camera | 1.5 Mbps | 0.675 GB | Lower bandwidth indoor or garage camera streams |
| Video doorbell HD events | 2 Mbps | 0.90 GB | Doorbell clips, visitor events, and live checks |
| Smart display HD call | 2.5 Mbps | 1.13 GB | Video calls, live viewing, and display streams |
| 1080p security camera | 3 Mbps | 1.35 GB | Common HD camera planning baseline |
| 2K security camera | 4 Mbps | 1.80 GB | Sharper camera feeds with moderate compression |
| 4K security camera | 8 Mbps | 3.60 GB | High-detail camera feeds or maximum quality mode |
📝Monthly Usage By Bitrate
| Internet Rate | 4 Hours Daily | 8 Hours Daily | 24 Hours Daily |
|---|---|---|---|
| 0.16 Mbps | 8.8 GB/month | 17.5 GB/month | 52.6 GB/month |
| 1 Mbps | 54.8 GB/month | 109.6 GB/month | 328.8 GB/month |
| 3 Mbps | 164.4 GB/month | 328.8 GB/month | 986.3 GB/month |
| 5 Mbps | 274.0 GB/month | 547.9 GB/month | 1.64 TB/month |
| 8 Mbps | 438.3 GB/month | 876.7 GB/month | 2.63 TB/month |
🔍Internet Mode Comparison Grid
| Mode | Internet Share | What It Represents | Planning Note |
|---|---|---|---|
| Cloud continuous | 100% | Traffic is sent to or from the internet while active | Use for cloud cameras, live remote monitoring, and calls |
| Motion or event cloud | 35% | Only active clips or selected events count heavily | Use event hours for a tighter estimate when known |
| Local plus remote checks | 15% | Most traffic stays local with some remote viewing | Good for NVR, hub, or local-first systems |
| LAN only | 0% | Traffic stays inside the home network | Still affects WiFi capacity, but not ISP data usage |
🏠Common Smart Home Scenarios
| Scenario | Assumption | Daily Data | Monthly Data |
|---|---|---|---|
| Video doorbell events | 2 Mbps, 1 hour/day, 35% cloud, 10% overhead | 0.35 GB | 10.5 GB |
| One 1080p camera | 3 Mbps, 8 hours/day, 35% cloud, 10% overhead | 4.16 GB | 126.5 GB |
| Four 1080p cameras | 12 Mbps, 8 hours/day, 35% cloud, 10% overhead | 16.63 GB | 506.0 GB |
| Whole-home music | 0.64 Mbps, 6 hours/day, 100% cloud, 10% overhead | 1.90 GB | 57.8 GB |
| Sensor hub telemetry | 0.10 Mbps, 24 hours/day, 100% cloud, 10% overhead | 1.19 GB | 36.2 GB |
💡Calculation Tips
Smart home devices can slow down your network speeds and increase your data bill because smart home devices create data streams. These data streams come from smart devices in your home, including security camera, doorbells, speakers, and smart hub. Each of these device is often on for long periods of time.
Often, homeowners only notice the impact that smart devices has on there internet plan once their network is crowded with other device or after they hit their data cap. The calculator in this article mathematicaly determine how much data your devices will use. The data measured here is the data that is sent to the internet.
How Much Data Do Your Smart Home Devices Use?
Data that is used within your local network isnt measured. While the devices connecting to your WiFi can saturate local networks, the data used within the local network does not count towards your internet data allowance. The data that is counted towards your internet data allowance is the data that is sent to the cloud.
The calculator can adjust the device profile to reflect the device you have in your smart home to provide you with an accurate reading. Devices like 1080p security cameras use three megabits per second of data. Three megabits per second is an amount of data that increase with the number of security cameras you have and the number of hours that those security cameras are in use.
Security cameras that record to local storage use your WiFi data allowance, but security cameras that record to the cloud use your internet data allowance. The mode for using the internet data for these devices can be adjusted in the calculator to show whether you use continuous remote viewing of your security cameras, motion detected clip only, or local storage only. The device active hours can also be adjusted in the calculator.
A doorbell may be active for only one hour per day, but a music system may be active for six or eight hours per day. These active hours is considered the actual on-time for the device in the calculator. The active hours adjustment will help to avoid overestimating the data that is used by your smart home devices.
Most device do not use data continuously, so the active hours adjustment will ensure that your data estimates are accurate. The quality and data overhead for each device can be adjusted in the calculator. Devices such as security cameras may use more data when showing high-quality scene with alot of motion within the scene.
The quality of the footage factor have the potential to increase the data used by a device by fifty percent or more. Data overhead is used to reflect the data that is used in the protocol of the device by the manufacturer. The default value is ten percent, but you can increase this number to reflect the weak signal strength of the device in your smart home.
The device data calculator will output a result that shows the daily data and monthly total for each device, as well as recommend an upload speed for the smart devices in your smart home. The recommended upload speed includes twenty-five percent headroom for the smart devices because internet speeds will never reach the maximum speed that is advertised for the internet plan. Eight megabits of upload speed will be recommended for cloud video for security device.
Eight megabits of upload speed can then be compared to your internet plan to determine if your internet service is adequate for your smart devices. While the calculator can show you the data that is used by your smart devices, the calculator does not factor in changes to your smart devices that may happen over time. Data may increase if you get a new pet for example, or if you change your vacation schedule to allow for smart devices to record your vacation.
While you may be able to decrease the data used by your devices by switching to local storage for your security cameras, the calculator only models the data use for your current smart devices. In most case, the upload speeds for smart devices are different than the download speeds. Most internet plans offer high download speeds for the data that is downloaded from the internet to your smart devices, but offer limited upload speeds.
Because most smart devices, such as security cameras, require high amounts of upload speed to the cloud, upload speed can become the bottleneck in your network. Ensure that the recommended upload speed for your smart devices is in accordance with your current internet plan to avoid stuttering smart device videos. Signal strength for the WiFi network in your smart home also impact the amount of data that your devices use.
A weak signal will result in the smart device attempting to retransmit the signal, which will increase the amount of data that is used by the smart device. This is why the overhead data buffer is set to a specific value. If the amount of data used by your devices is higher than the data that is calculated by the calculator, it is possible that the cause is weak signal strength between your smart devices and your router.
Moving your smart devices closer to the router or improving the signal strength will reduce data use more effectively than lowering the resolution settings for your smart cameras. The device data calculator allows you to model the data use for separate categories of devices. Devices like smart displays use data in short bursts during video calls, yet sensor hubs use very small amounts of data for their sensors throughout the day.
Using the device profile for these separate categories will allow you to see which devices are using the most data within your smart home. While a few devices with higher data use settings for quality of video may use less data than a device with a higher resolution, the number of devices that is using data on your WiFi network will still have to be considered. In addition to the device categories, the time of year may also have an impact on data use by the devices in your smart home.
During the summer, outdoor security cameras may pick up more motion from your yard than during the winter months. During the winter, smart displays may be used more within the smart home. Using the daily total data for each device allows you to calculate the total data that is used by each device each month.
Using the daily data use for each device multiplied by the number of days in the month will allow you to project the total data that will be used by each device. These scenarios can be used to calculate data use in the different months of the year if data use differs from season to season. The main goal for using this calculator is to provide you with a better understanding of your data use.
By understanding how much data each device in your smart home uses daily and monthly, you can make better decisions regarding your smart devices. For example, if you understand how much data each device uses, you can decide whether you need local storage for your devices or whether you need to increase your data plan. The calculator will remove the need for you to perform the mathematics for each scenario in your smart home to understand how they may impact your data use.