Busbar Current Carrying Capacity Calculator
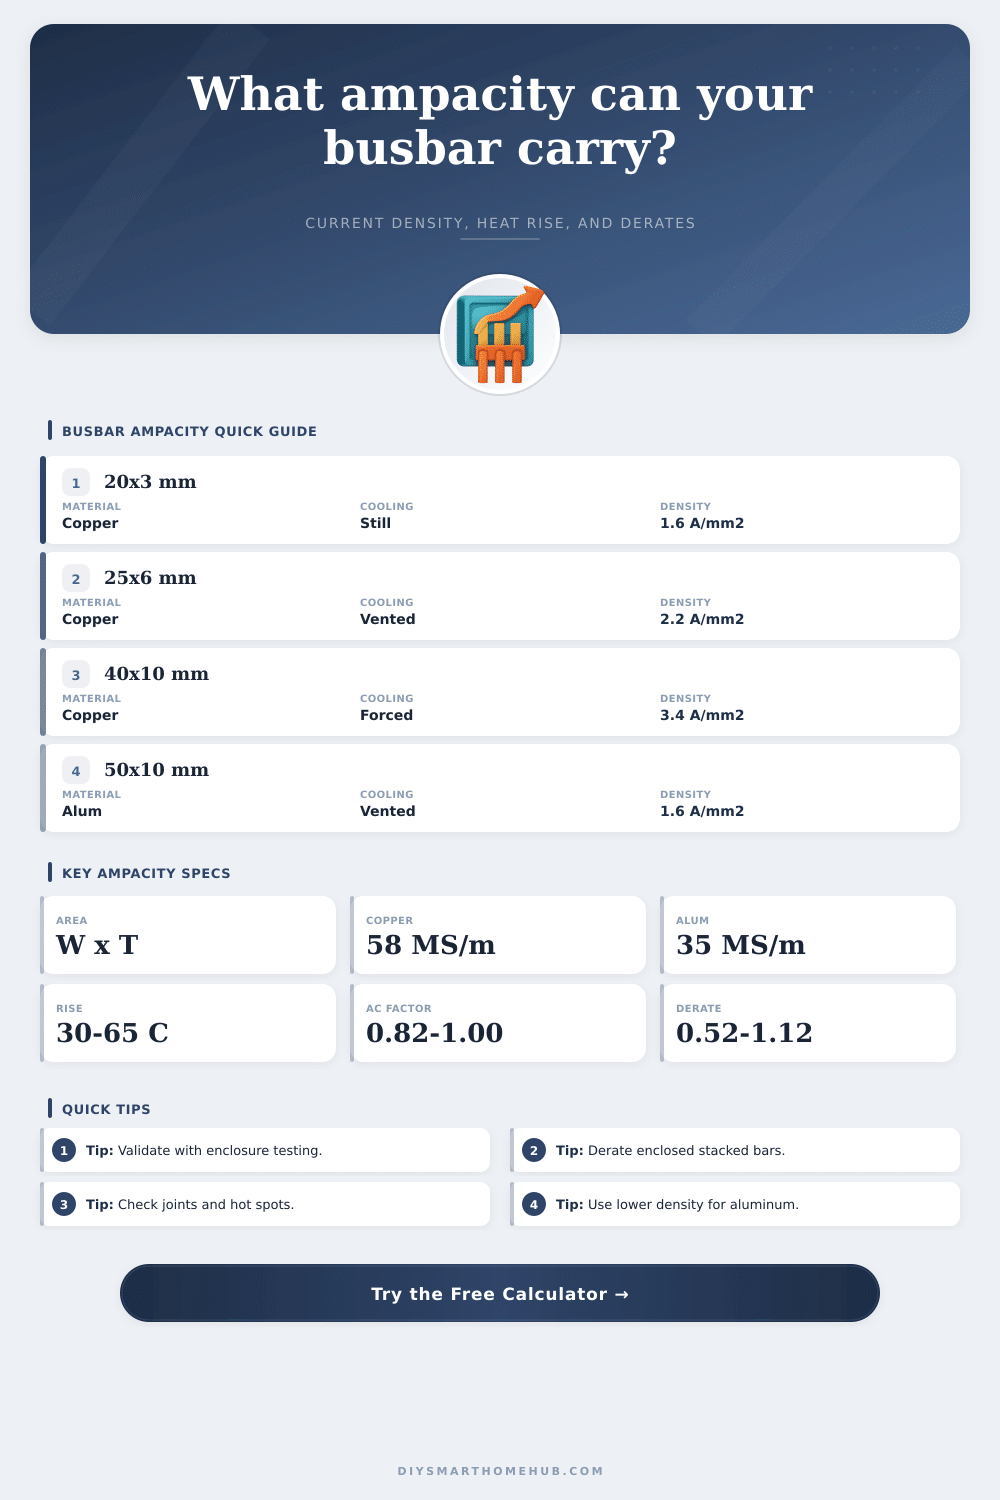
Estimate recommended busbar ampacity from width, thickness, material conductivity, temperature rise, cooling, enclosure derate, AC proximity factor, and target current density.
📌Busbar ampacity presets
📏Calculator inputs
This calculator provides engineering estimates. Final equipment ratings depend on tested assemblies, terminals, insulation class, spacings, protective devices, and local code requirements.
⚙Material and cooling spec grid
Recommended busbar ampacity
📊Reference tables
| Design density | Typical condition | Cooling assumption | Use as |
|---|---|---|---|
| 1.0 to 1.5 A/mm2 | Sealed or warm enclosure | Still air, limited heat escape | Conservative continuous baseline |
| 1.6 to 2.4 A/mm2 | Open or vented cabinet | Natural convection around flat bar | Common panel busbar estimate |
| 2.5 to 3.5 A/mm2 | Fan-assisted assembly | Forced airflow over broad faces | Higher density with temperature checks |
| 3.6 to 5.0 A/mm2 | Heat-spreader or tested stack | Verified thermal path | Use only with assembly validation |
| Material | Conductivity | Resistivity at 20 C | Calculator factor |
|---|---|---|---|
| Copper C110 or ETP | 58 MS/m | 1.724e-8 ohm m | 1.00x ampacity base |
| Tinned copper | 56 MS/m | 1.79e-8 ohm m | 0.98x conductivity factor |
| Aluminum 6101 or 1350 | 35 MS/m | 2.82e-8 ohm m | 0.78x conductivity factor |
| Brass strip | 15 MS/m | 6.67e-8 ohm m | 0.51x conductivity factor |
| Cooling / enclosure | Thermal factor | Airflow derate | Typical note |
|---|---|---|---|
| Sealed enclosure | 0.72x | 0.78x to 0.88x | Heat accumulates near busbar |
| Open still air | 1.00x | 0.88x to 1.00x | Baseline natural convection |
| Vented enclosure | 1.08x | 0.88x to 1.00x | Better chimney airflow |
| Forced airflow | 1.22x | 0.88x to 1.00x | Fan improves heat removal |
| Heat spreader bond | 1.30x | 0.88x to 1.00x | Conductive thermal path |
| Example busbar | Area | Open copper estimate | Conservative use |
|---|---|---|---|
| 20 x 3 mm | 60 mm2 | 105 to 145 A | Small DC branch or control bus |
| 25 x 6 mm | 150 mm2 | 260 to 360 A | Battery cabinet distribution |
| 40 x 8 mm | 320 mm2 | 560 to 770 A | Charger or inverter DC link |
| 50 x 10 mm | 500 mm2 | 875 to 1200 A | Main bus with verified joints |
| 60 x 10 mm | 600 mm2 | 1050 to 1440 A | High-current panel assembly |
💡Practical calculation tips
Heat plays a big role in designing your electrical system. By defining your physical constraints, the calculator turn abstract ampacity tables into actual numbers that apply to your construction.
The thermal risks within sealed metal cabinets is invisible to most. These places accumulate heat much more quicker than air can remove it. Even though a busbar appear thick, if the air around it is hot enough, it will melt its own insulation. Conductors should of sized as a heat issue, not just an electrical one.
Why Heat Matters for Electrical Design
It’s not just width that matters, it’s surface area. Because heat dissipates from the perimeter of the bar, a narrow but thick bar will be colder than a wider but thinner bar with same total surface area. That’s what the calculator want, both the width and thickness independently. What you’re describing is shape that resists convection. Unless, that is, you shove the bar into a densely-packed wireway where there’s no room for air circulation, in which case all those gains goes out the window. If the environment lets the bar breathe, then its shape does you good. Otherwise…
Things get more complicated with material selection. For the most part, copper is used since it conduct well and behaves predictably. Aluminum is lighter and cheaper but requires a greater cross section to conduct as much current. The tool will adjust according to what material you choose. Tinned copper can be added to improve corrosion resistance at some loss of conductivity. Main power is usually copper; however, brass makes occasional appearances in control circuits that require a bit more mechanical strength.
The biggest lever you have control over is temperature rise. Typical designs will specify a rise of about 45 degrees C from ambient, which maintains both the integrity of the insulation and the stability of the connections. If you push that up, you can increase capacity. However, you also risk causing things to warp, potentially even warping the busbar itself, or degrading other nearby components. The calculator lets you specify that limit. A battery cabinet in a cool room can handle a steeper rise than an inverter stack in a sun-baked utility closet.
Know your ambient temperature. If the day is 50 degrees outside, then your equipment inside start off at a disadvantage before any current flows. DC designers don’t need to concern themselves with skin and proximity effects from AC current. Current flows on surface of the conductor at normal frequencies. That effectively shrinks the effective area of the metal. Worse yet, stacked phases create currents in nearby bars (think induction). The tool takes all this into account with a proximity factor depending on how the phases are laid out. Stack three phase conductors closely together and they heat each other, which reduces each one’s capacity much more then if each were an isolated bar. A little thing, but when margins is tight, it matters.
The last two outputs from your design check are voltage drop and heat dissipation. Low voltage drop implies little power wasted in heat. Large wattage losses imply high current being pushed through inadequate metal, or that cooling conditions is poor. These numbers are the story of what happens within the enclosure under peak load. On that page, there is also a reference table which outlines normal density values for various cooling situations. That’s so you have a sanity check on what you calculate.
However, real enclosures are dynamic while a table is static. Seasonal variations will change airflow, and so will opening doors or fans failing. If at all possible, physically test your assumptions. Run it under load to see what the actual temperature increase is before calling a design finished. The numbers help lead you, but ultimately thermodynamics win.
Respect the limits when designing for current carrying capacity. Respect it but don’t push it. Instead of finding the maximum, design it to work reliably every day, year after year. These bars can be touched with bare hands while working on them because they are cool enough. These connections won’t creep or oxidize as they change temperature. When you get the cooling part right, the rest comes naturaly. Well designed busbars do both, conduct electricity and manage heat.