WiFi Airtime Calculator
Estimate how much of a WiFi channel is consumed by smart cameras, hubs, TVs, sensors, calls, and shared household traffic.
Estimated Channel Load
| Mode | 20 MHz 1SS | 40 MHz 1SS | 80 MHz 1SS | 160 MHz 1SS |
|---|---|---|---|---|
| 802.11g 2.4 GHz | 54 Mbps | Not used | Not used | Not used |
| 802.11n WiFi 4 | 72.2 Mbps | 150 Mbps | Not used | Not used |
| 802.11ac WiFi 5 | 86.7 Mbps | 200 Mbps | 433.3 Mbps | 866.7 Mbps |
| 802.11ax WiFi 6/6E | 286.8 Mbps | 573.5 Mbps | 1201 Mbps | 2402 Mbps |
| 802.11be WiFi 7 | 344 Mbps | 688 Mbps | 1441 Mbps | 2882 Mbps |
Rates are common maximum PHY link rates per spatial stream. Real airtime depends on modulation, guard interval, signal quality, ACK behavior, and contention.
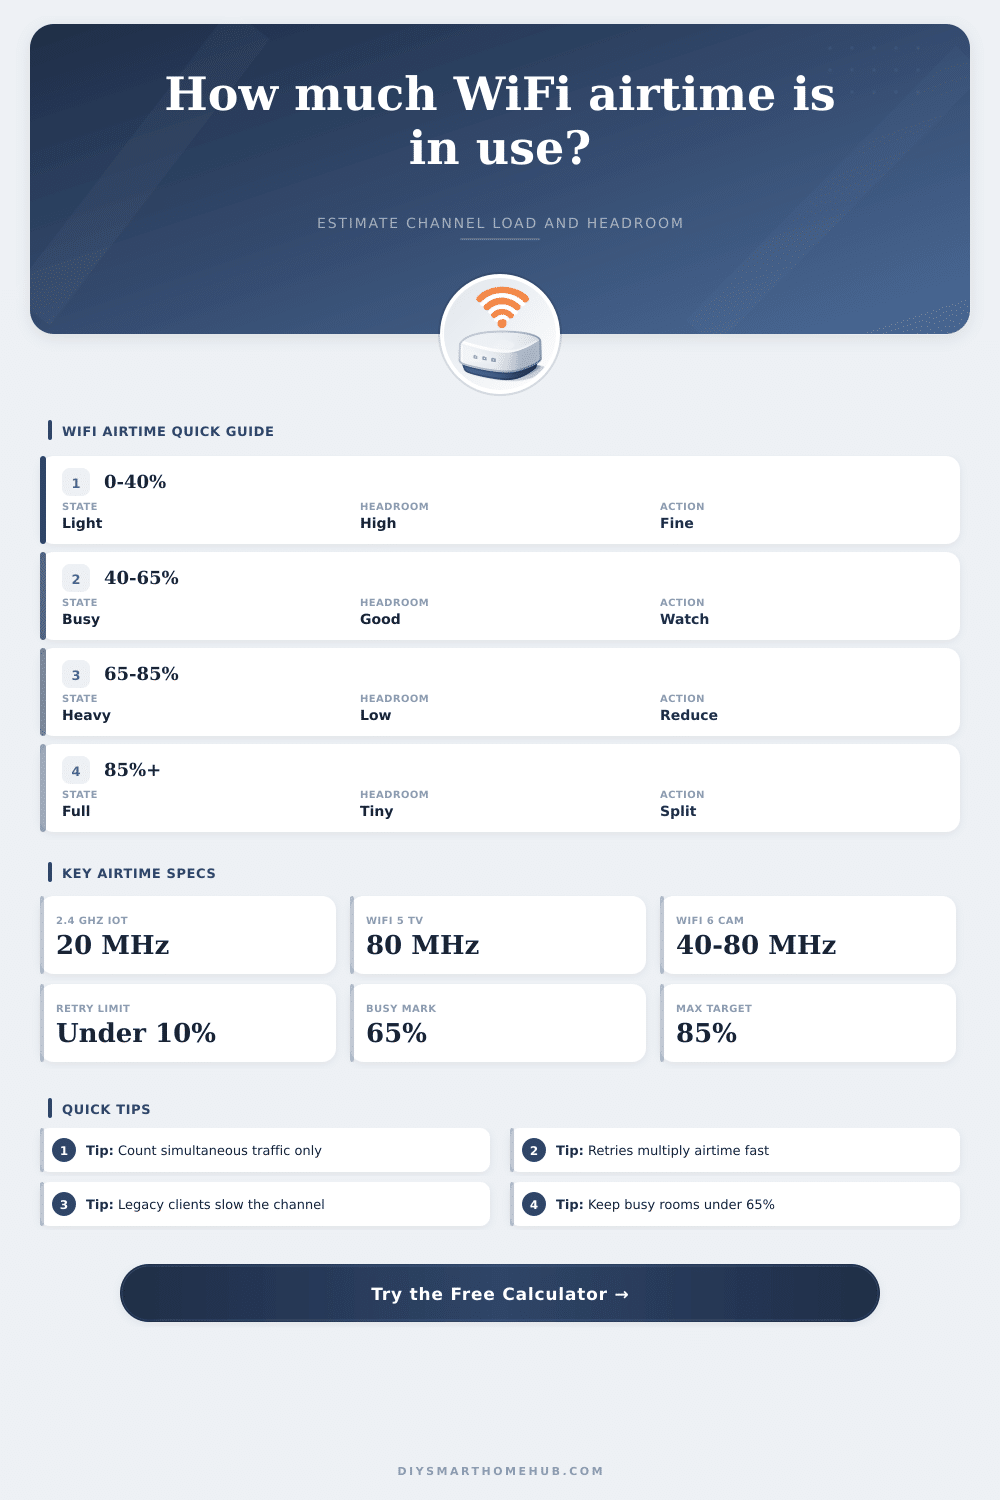
| Total Airtime | Channel State | Expected Feel | Planning Use |
|---|---|---|---|
| 0% to 40% | Light | Responsive with room for bursts | Sensors, speakers, normal browsing |
| 40% to 65% | Busy | Usually stable with careful placement | Smart TVs, calls, several cameras |
| 65% to 85% | Heavy | Latency and retry spikes become visible | Short bursts or planned high-load zones |
| Above 85% | Saturated | Little room for roaming or retransmits | Split clients, lower load, or add capacity |
| Device Type | Typical Payload | Traffic Pattern | Airtime Note |
|---|---|---|---|
| Door sensor or switch | 0.01 to 0.05 Mbps | Short bursts | Low data, but many devices add contention |
| Smart speaker idle plus voice | 0.1 to 1 Mbps | Bursty audio and control | Usually light unless grouped |
| 1080p WiFi camera | 2 to 5 Mbps | Continuous upload | Retries matter because stream is constant |
| 2K or 4MP camera | 4 to 8 Mbps | Continuous upload | Can dominate 2.4 GHz quickly |
| 4K video stream | 15 to 25 Mbps | Continuous download | Works best on clean 5 GHz or 6 GHz |
| HD video call | 3 to 6 Mbps | Two-way real time | Sensitive to airtime above 65% |
| Scenario | Mode | Active Load | Why It Matters |
|---|---|---|---|
| IoT shelf on 2.4 GHz | WiFi 4, 20 MHz, 1SS | 18 devices at 0.08 Mbps | Small packets still contend for airtime |
| Two 1080p cameras | WiFi 5, 40 MHz, 1SS | 2 devices at 4 Mbps | Continuous upload exposes retries |
| 4K media room | WiFi 5, 80 MHz, 2SS | 3 devices at 18 Mbps | High throughput needs clean headroom |
| WiFi 6E media cluster | WiFi 6E, 160 MHz, 2SS | 6 devices at 22 Mbps | Large PHY rates keep airtime low |
A wireless network can slow down for a variety of reasons, one of which is if there are too many device connecting to the wireless network and using up all of the available airtime. Airtime refer to the amount of time that the wireless devices in the network use the wireless channel to transmit data. It does not matter how high the speed test reads on the device; if all of the airtime is taken up by the devices in the network, the wireless network will be slow for each of the devices that is connected.
Airtime is the most important factor within the wireless network; airtime is more important than the speed that the device box advertises for the device. If the airtime usage reaches too high of a percentage within the wireless network, the wireless network will become congested and each of the devices will experience slow connection to the wireless network. One of the best ways to determine the amount of airtime that is being used within a wireless network is through the use of the airtime calculator.
How to use an airtime calculator
In the calculator, a user will input the WiFi mode of the wireless network, the channel width, the number of spatial stream for the network, the number of wireless devices that are active at the same time, and the amount of data that each of those devices is transmitting. After these values are entered into the airtime calculator, the calculator will factor in other types of data movement within the wireless network, such as retries, background traffic, and other factors. The result of the calculator will not be the speed of the wireless network; instead, the result will be a load percentage value for the wireless network.
That load percentage will indicate whether or not the wireless channel has remaining airtime for new devices and data packet, or if the channel is nearing it’s maximum airtime. For many individuals, the difference between airtime and the available speed within the network is discover in frustrating ways. For instance, a house may contain twenty sensors and two doorbell device that use the wireless network.
These devices may not be utilizing much airtime, though, because they only use the wireless network for a few data packets before returning to sleep. If, though, two 1080p cameras and a 4K camera are also added to the house, the users may experience a noticeable difference in the wireless channel. The wireless channel must send packets to each of these devices, and each of these packets takes up airtime for the wireless network.
The airtime calculator is one of the best tool to make visible the amount of airtime that each device is using. The choice of the channel width and the band on the wireless network can have a major impact on the amount of airtime that is available for each device. For instance, if the devices in the wireless network are using a 20 MHz link on the 2.4 GHz band, there is a limit to the number of data streams of the wireless channel that can be establish before the wireless network begins to become slow for each of the wireless devices.
If, though, those same devices are connected to an 80 MHz channel on the 5 GHz band, there will be more airtime available to each device. The airtime calculator makes it possible for the user to change modes and channel widths to see how the airtime changes. The calculator will not provide the perfect wireless configuration for a house, but it does allow the user to remove the guesswork in establishing the proper wireless bandwidth for the devices.
In addition to channel width, another factor that affects airtime is the number of retries that is established for each data packet. If a device must send data packets into the wireless network, but those packets are often lost, the device will have to send those packets again. This retry function uses up additional airtime for each device; the more retries that is established for each device, the more airtime that the device will use for the wireless network.
If the retry percentage for each device reaches percentages in the.20 or.30 range, it indicates that the device is establishing many data packets. The user can enter this retry percentage on the wireless airtime calculator. While users often ignore this percentage when utilizing the wireless network, it is a valuable factor in determining airtime for the wireless network.
Another factor in the airtime calculator is background traffic. Background traffic includes the data packets sent when devices broadcast their networks, other data between wireless access points, and other background data in the wireless network. If there is little background activity within the wireless network, the percentage of airtime taken up by background traffic will be minimal.
However, if the wireless network is a busy apartment that contains many wireless networks, the percentage of airtime that background traffic takes up can reach high percentages before any data from the users devices begins to travel on the network. This value within the calculator allows the user to determine how much of the airtime within the wireless network is available to the devices in the network. The reference tables on the calculator can provide users with the expectations of their wireless network.
These tables can show the amount of data that can be sent on each channel width for each spatial stream number for the wireless network, as well as the percentage of airtime that is typically used by each percentage of data sent. These tables will help the user to understand if an airtime percentage of 40% is acceptable in their network or if 80% is too high for there needs. The user will not remember these tables, but they will be valuable in understanding the percentage of airtime that the calculator calculates for each wireless device in the network.
One of the most common mistake made by individuals that use wireless networks is not counting each device in their house; instead, they should only count the devices that are using the airtime and data together. For instance, a household may have ten smart bulbs and two doorbell devices that use the wireless network. These devices may not use much airtime.
However, three different HD cameras, a video call, and a data backup to the cloud may all use a significant amount of airtime, especially if they are all occurring within the same ten-minute period. The airtime calculator will show incorrect results if the user enters incorrect data for the number of active devices using the wireless network. Another of the most common error in the management of wireless networks is ignoring the suggestion that the addition of a faster access point will increase the data rate of the wireless network.
The rate of each device that is connected to the wireless network will still be affected by the rate of other devices, regardless of the new access point. The user can see this problem with the airtime calculator; the user can add the same data to different modes within the wireless network to see how each device will fare with the new access point. In this case, the answer is not a faster wireless network; it is a new location for one or more device on the wireless network.
In most cases, users should aim to keep the percentage of airtime used by their network to 2/3 of the maximum airtime during there normal hours. If users can limit the amount of airtime to 2/3, there will be margin for additional devices, additional data bursts, and for the wireless network to account for data packets that are retransmitted due to interference within the network. Though the airtime calculator will not replace a signal meter for the wireless network, it will provide an individual with a number that can be used to understand if their wireless network is experiencing slowdown due to airtime issues.
Additionally, a smart home that is responsive to the devices in the home will be a smart home with a wireless network and channel that have some breathing room when each device is active.