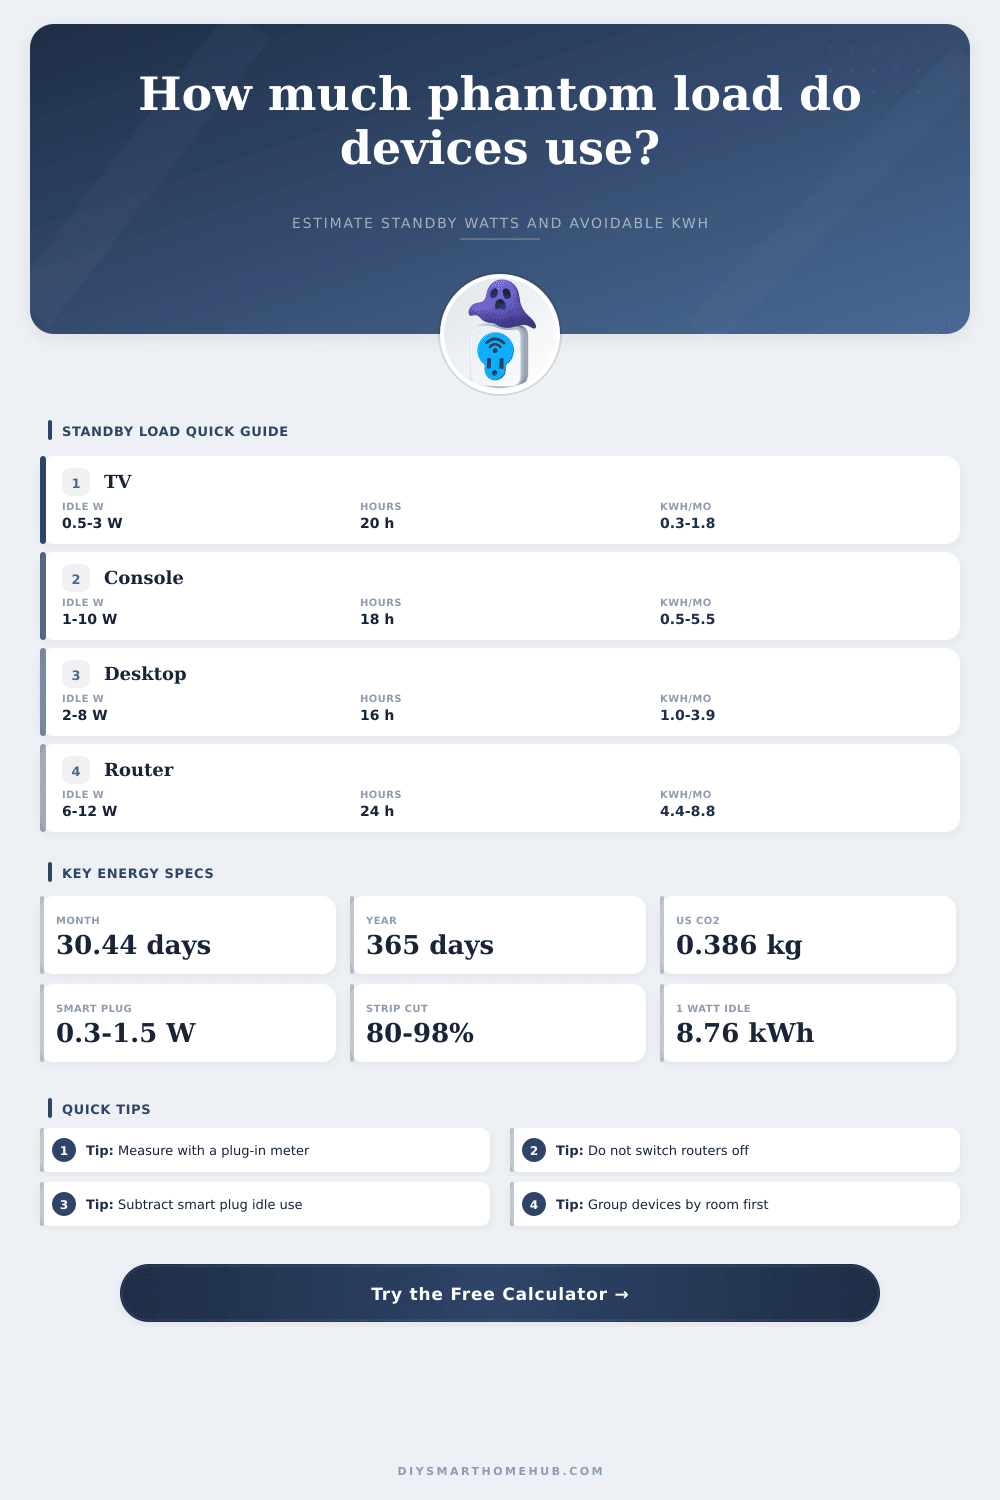
Phantom Load Calculator
Estimate standby watts, monthly kWh, avoidable energy, controller overhead, and annual impact for always-plugged home electronics.
🏠Real home presets
🔌Standby load inputs
Phantom load results
⚙Spec comparison grid
Quick-start and network wake modes raise the idle draw.
Download and USB charge modes can keep loads active.
Usually essential, so separate from switchable loads.
Displays, docks, and speakers often add hidden draw.
Small alone, meaningful when dozens stay plugged in.
Clock, touch panel, or wireless modules draw continuously.
Controller overhead must be subtracted from savings.
Real reduction depends on grouping and bypass loads.
📊Typical standby draw table
| Device or group | Typical standby draw | When to count it | Control note |
|---|---|---|---|
| Television in standby | 0.5 W to 3 W | Off, remote-ready, network wake enabled | Often switchable if no recording or wake feature is needed |
| Set-top box or DVR | 8 W to 25 W | Guide, tuner, or recording features active | Usually avoid switching when recordings or provider updates matter |
| Game console rest mode | 1 W to 10 W | Instant-on, downloads, USB charging, or wake modes | High value target when update features are disabled |
| Desktop, monitor, and speakers | 2 W to 12 W | Sleep mode, dock powered, display soft-off | Good candidate for a master-controlled power strip |
| Router, modem, and mesh node | 6 W to 15 W | Continuous network operation | Usually not switchable because it provides core service |
| Microwave or oven clock | 1 W to 5 W | Clock, display, touch panel, radio module | Switch only if losing clock and memory is acceptable |
| Phone charger left plugged in | 0.05 W to 0.5 W | No phone attached, adapter still energized | Low priority unless many adapters are grouped |
| Smart speaker or display | 1.5 W to 8 W | Always listening, screen idle, cloud connection | Usually intentional always-on smart home load |
🔋Controller overhead comparison
| Control type | Typical idle draw | Best use | Calculator treatment |
|---|---|---|---|
| Manual switched strip | 0 W | Entertainment centers and desk clusters | No controller overhead, cutoff can be near 98% |
| Basic smart plug | 0.3 W to 1.5 W | One appliance or one small strip | Subtracts 24-hour plug energy from reduction |
| WiFi smart power strip | 1 W to 3 W | Several outlets with app control | Count one controller for the strip electronics |
| Master-controlled strip | 0.5 W to 2 W | Computer or TV turns accessories off | Use 90% to 95% cutoff for switched outlets |
| In-wall relay module | 0.2 W to 0.8 W | Fixed loads that can be safely controlled | Use measured relay idle watts when available |
🏘Common project size table
| Project scan | Counted load | Monthly standby energy | Likely avoidable share |
|---|---|---|---|
| Single TV media stand | 5 devices at 3 W each | About 9.1 kWh at 20 h/day | 50% to 80% if no DVR or network wake is needed |
| Gaming and monitor desk | 6 devices at 4 W each | About 11.0 kWh at 15 h/day | 65% to 90% when sleep charging is disabled |
| Home office cluster | 8 devices at 2.5 W each | About 9.7 kWh at 16 h/day | 60% to 85% with a master strip |
| Apartment sweep | 20 small loads at 1.8 W each | About 21.9 kWh at 20 h/day | 35% to 60% after essential devices are excluded |
| Whole-house audit | 45 loads at 2 W each | About 65.7 kWh at 24 h/day | 25% to 50% because many loads are intentional |
✅Measurement and formula references
| Reference item | Formula or value | Use in calculator | Practical note |
|---|---|---|---|
| Power to energy | W x hours / 1000 = kWh | Converts instant standby draw to daily energy | Use real measured watts whenever possible |
| Monthly energy | Daily kWh x days plugged in | Matches the selected number of active days | 30.44 days is a calendar average month |
| Controller overhead | Controller W x 24 h x days / 1000 | Subtracts smart plug or relay idle energy | Manual switches have no standby overhead |
| Net reduction | Avoidable kWh - controller kWh | Shows the energy actually reduced | Negative results mean the controller uses more energy |
| Carbon estimate | 0.386 kg CO2e per kWh | Optional impact estimate in the breakdown | Regional grid factors can differ substantially |
💡Calculation tips
The calculator estimates energy only. It does not evaluate electrical safety, appliance memory loss, data updates, battery charging needs, or device warranty requirements.
Phantom load is the electricity that device use while in standby mode. Many device, such as televisions, game consoles, and routers, continue to use electricity even when the devices are turned off. This electricity is known as phantom load.
Phantom load occur in these devices because they must always be ready for signal or network command to wake the devices up. Because these devices use electricity while in standby mode, phantom load can contribute to increased electricity bill each month for these individuals. Another method to calculate the phantom load cost is through the provided calculator.
What is phantom load and how to reduce it
The calculator will ask for information regarding the standby draw of the devices, the number of hours that the devices will be in standby mode each day, and how many of those phantom loads can be switched off. For instance, some devices that must remain on include those that provide essential service to the home. You can switch off devices that do not provide essential services in order to reduce phantom loads.
Smart plugs and smart power strips can be used to switch the power to the devices to reduce phantom loads. However, smart plugs and smart power strips will also use some of the electricity in the home in order to provide control to these devices. The calculator will subtract this electricity from the phantom load calculations in order to provide an accurate calculation of the total potential electricity that will be used in the home.
Thus, if the smart plugs use more electricity than the devices that are to be turned off, then using smart plugs wont reduce the electricity use in the home. Phantom loads in sleep mode is often thought to be a harmless amount of electricity. However, if many devices are in sleep mode, the amount of sleep mode can add up.
For instance, a device that uses one watt of electricity is not a significant amount. However, if there are many devices that use eight watts of electricity, that amount of power can be noticeable. Furthermore, it is also possible to group devices that are of the same type in the same power strip in order to manage the phantom loads for each group of devices.
Grouping devices in the calculator allows for those device groups to be entered in the calculation in the same way that the rooms in the home may be wired. It is important to separate essential devices from nonessential devices when calculating phantom loads. Essential devices include devices like routers, security bridges, and medical devices.
These type of devices must remain on in order to provide their essential services. Thus, the calculator will set the phantom load for these devices to zero. If these devices are treated as entertainment gear, however, the calculations will show that phantom loads can be saved, but the actual phantom loads will be lower.
Refer to the table included in the article to separate essential devices from non-essential devices. The type of measurement for electricity can impact the phantom load calculations. Many devices may not be drawing the correct amount of electricity while in standby mode.
For example, devices may take a few minutes to reach their true standby mode while in sleep. If the electricity is measured too soon after the device is switched off, phantom load calculations may show a higher number than the true phantom load for the devices. Thus, to obtain a true measurement, use a plug-in meter for the devices and leave the meter in place for ten minutes to allow the devices to reach their true standby mode.
The calculator is designed to provide the discretionary portion of phantom load. For instance, the calculator will remove devices in the home that are not discretionary devices, such as refrigerators and furnace controls, from the calculation. These devices are an intentional part of the home.
Thus, the calculator does not calculate all of the phantom loads for the devices in the home, but calculates the phantom loads for the devices that can be switched off. Beyond the calculation of phantom loads, the calculator also calculates the potential impact of the saved electricity on the climate. For instance, the standard grid factor is used to calculate carbon impact.
The grid factor will change according to the device’s location in the region of the country. Thus, the results can be manually adjusted according to these factors. The amount of phantom loads that will be saved will not change with the altered carbon impact values of the devices.
It is important to note that the results of phantom load calculations are not the final answer. For instance, phantom loads may change over time. Manufacturers may have created firmware updates for the devices that have changed how they enter sleep mode and draw electricity.
Additionally, devices may age and become less efficiently over time. Thus, the calculation can be performed again after several months. It is a mistake to calculate the average phantom load for the house without calculating each room in the house.
For example, the devices in the kitchen may be of a different type than devices in other parts of the house. Thus, the phantom load that is created in the kitchen may not be the same as other parts of the house. Calculations should be made based off each room in the house.
Furthermore, the preset buttons for the various rooms will help users to determine the phantom load in each area. After calculating each room in the house and determining the net amount of electricity that will be saved each year, it is important to determine if that amount of electricity is worth the effort that would be required to switch each group of devices to smart power strips or smart power strips. For instance, the bedroom may have a higher number of devices that draw less electricity, so there will be a smaller impact on electricity use.
In contrast, the media center in the house may have a higher amount of devices that draw a significant amount of electricity. The information provided in terms of kilowatt-hours will allow individuals to calculate the savings according to there local electricity rate. Thus, although the amount of electricity that each device draws is small, phantom loads from devices everywhere in the home can add up to significant amounts.