LiFePO4 Charge Time Calculator
Estimate charge hours for LiFePO4 battery banks using capacity, SOC window, charger current, BMS current limit, C-rate, CC/CV taper, and temperature derating.
This tool estimates charge time for LiFePO4 batteries only. Always follow the battery maker's BMS limits, low-temperature charge rules, and charger voltage settings.
| Nominal bank | Cells in series | Typical LFP charger voltage | Use this setting for |
|---|---|---|---|
| 12.8 V | 4S | 14.2 to 14.6 V | RV, boat, power backup, small solar banks |
| 25.6 V | 8S | 28.4 to 29.2 V | Trolling motors, 24 V inverters, larger solar banks |
| 38.4 V | 12S | 42.6 to 43.8 V | Specialty DC systems and custom packs |
| 48.0 V | 15S | 53.3 to 54.8 V | 48 V carts and equipment packs |
| 51.2 V | 16S | 56.8 to 58.4 V | Server rack batteries and home backup packs |
| Charge style | C-rate | Current on 100 Ah | Planning note |
|---|---|---|---|
| Storage-friendly | 0.10 C to 0.20 C | 10 A to 20 A | Low heat, long charge, good for unattended top-ups |
| Conservative daily | 0.25 C to 0.35 C | 25 A to 35 A | Common for RV converters and solar controllers |
| Normal fast | 0.40 C to 0.50 C | 40 A to 50 A | Check BMS, cable, charger, and temperature limits |
| High-rate rated | 0.70 C to 1.00 C | 70 A to 100 A | Only for packs specifically rated for this charge rate |
| Battery temperature | Charge derate used | What it means | Calculator behavior |
|---|---|---|---|
| Below 0 C | 0% | LiFePO4 charging is typically blocked | Shows a cold-charge warning |
| 0 C to 5 C | 5% | Only special low-current charging if allowed | Severely limits current |
| 5 C to 10 C | 25% | Cold pack, charge slowly | Applies strong current derate |
| 10 C to 20 C | 60% | Cool pack, moderate charging | Applies partial current derate |
| 20 C to 35 C | 100% | Normal LiFePO4 charging range | Allows full selected current |
| 35 C to 45 C | 85% | Warm pack, reduce current | Applies mild current derate |
| 45 C to 50 C | 50% | Hot pack, charge carefully | Applies heavy current derate |
| Preset | Bank | Default charger | Typical result |
|---|---|---|---|
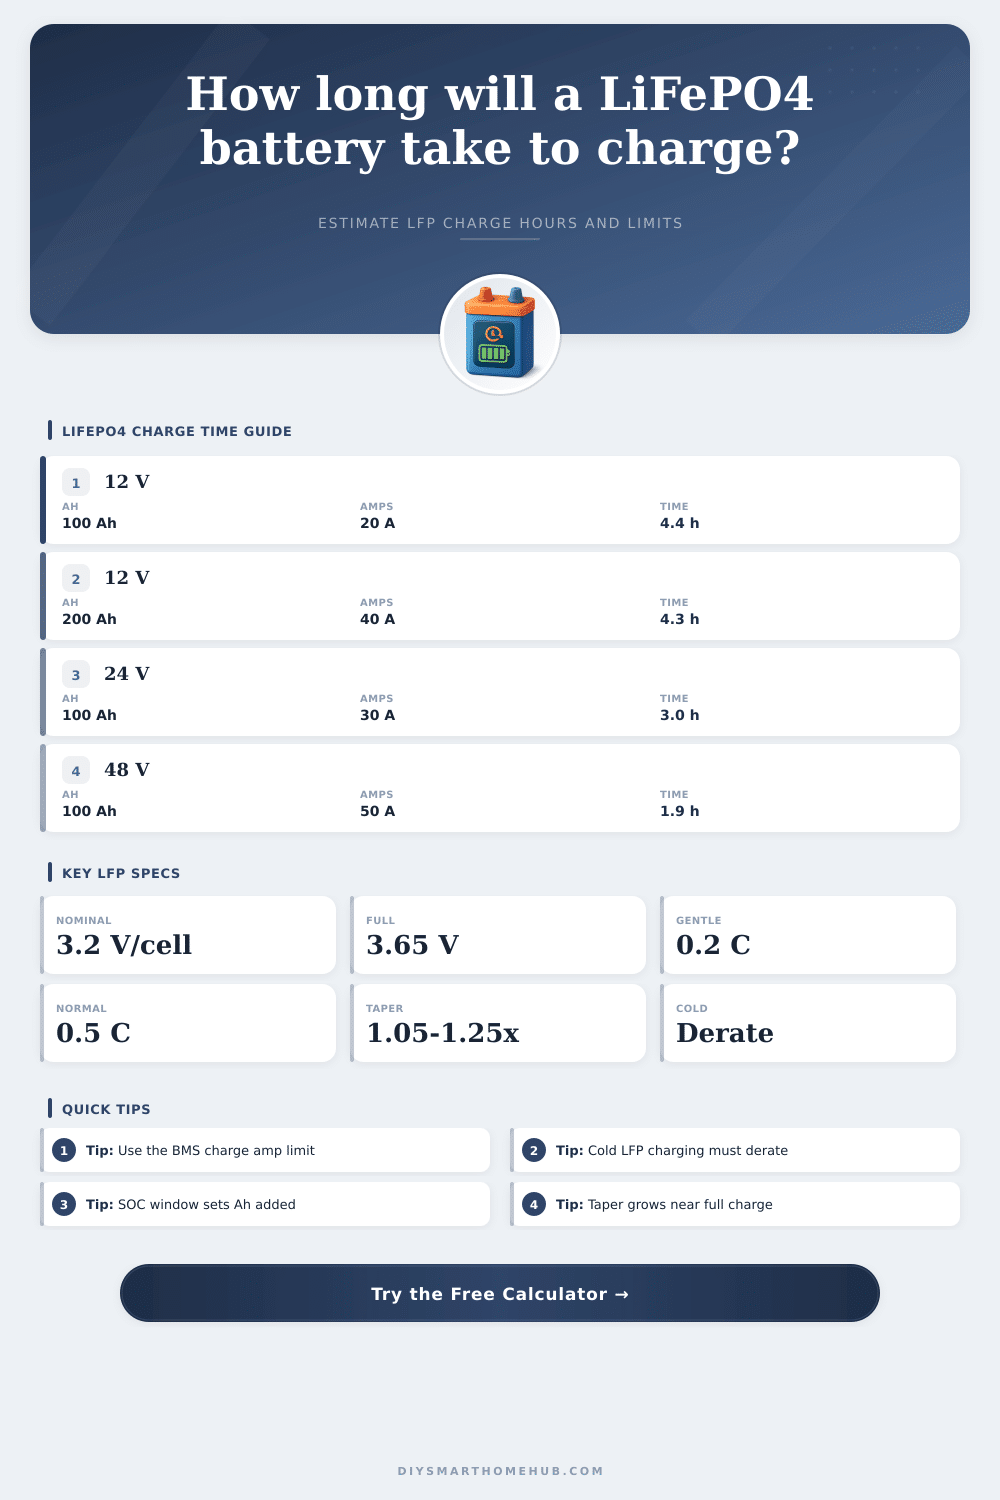
| 12 V RV 100 Ah | 12.8 V, 100 Ah | 20 A | About 4 to 5 hours from 20% to full |
| Van 280 Ah | 12.8 V, 280 Ah | 60 A | About 4 to 6 hours from mid SOC |
| 24 V Solar Bank | 25.6 V, 200 Ah | 50 A | About 3 to 4 hours for a 20% to 90% window |
| 48 V Rack Battery | 51.2 V, 100 Ah | 50 A | About 2 hours for a 30% to 95% window |
Charge Cycle LiFePO4 batteries well, as they will last longer and provide more energy with good cycle life and energy density. It is not just about the charger’s current or the battery capacity when it comes to how long they takes to recharge. There is some math to consider such as temperature effects and BMS limiting factors. We’ve built this into a calculator that accounts for those variables and lets you get out there running the boat while worrying less about monitoring everything.
The rate of charge isn’t necessarily dictated by your charger. For instance, you could purchase a high current charger only to have the Battery Management System throttle back to a slower charge. The Battery Management System may be set to cap incoming current, which limits the rate of charge. The calculator assumes that the slowest one among your battery, BMS, and charger is the limiting factor. This avoids having to be frustrated when the system slows down for safety reasons.
How to Charge Your Battery Safely and Quickly
Another aspect that’s frequently overlooked when it comes to charging speed is temperature. Unlike other batteries, lithium iron phosphate chemistry doesn’t respond well to cold weather. Below freezing, the battery’s chemistry can cause lithium metal to plate onto the anode, destroying cell capacity forever. Fortunately, most moddern BMS units are programmed to shut down once they sense their battery is below 0 degrees Celsius. Even above zero but below ten degrees Celsius, you’ll need to dial back current or risk damaging your battery.
To avoid doing so, the tool takes into account estimated surrounding temperatures and applies appropriate derating factors. You’ll notice that the calculator predicts longer charging times if your vehicle sits inside an unheated garage all winter. That’s because preserving the battery’s health trumps any perceived “software errors.”
How fast it charges depends on your state of charge window. It is faster to go from 20% to 90% than it is to go from 95% to 100%. Why? Because the charger drop the current as it nears the end to maintain a safe level of voltage. That last part requires more time in proportion. Is it really worth waiting hours for an extra few percent? Ask yourself if you need to fully charge each day. Having a little reserve might not affect your runtime much but could save you time.
These systems aren’t as efficient as previous technologies, but that’s not a big deal. In LiFePO4 batteries, nearly all of the energy entering the battery is saved as stored potential. Some of it will be wasted as heat while being charged. The calculator has an efficiency factor that accounts for real world loss rates. So if your batteries is 95 percent efficient, then you’ll lose 5 percent of the energy from a solar array or shore connection. That doesn’t seem like much until you’re doing a long trip where you can’t always run them at full power and each watt-hour matters.
Knowing the limits allows you to have reasonable expectations. Cold temperatures won’t give you fast charge times; your BMS might limit current and you can’t push it past that with a high-amp charger. Matching what technology does well with what the environment provides eliminates the guessing game and lets you plan ahead. It’s about reliability, not just speed. Being able to predict the duration of recovery for a given situation puts you in control of your power use. That knowledge makes potential emergencies something you can manage as part of your routine, so you keep things humming along and batteries happy when they’re needed.