Energy Efficiency Factor Calculator
Compare your home energy use against a climate-adjusted baseline and estimate how smart controls change the final efficiency factor.
⚙Unit System
🏠Real Home Presets
📊Calculator Inputs
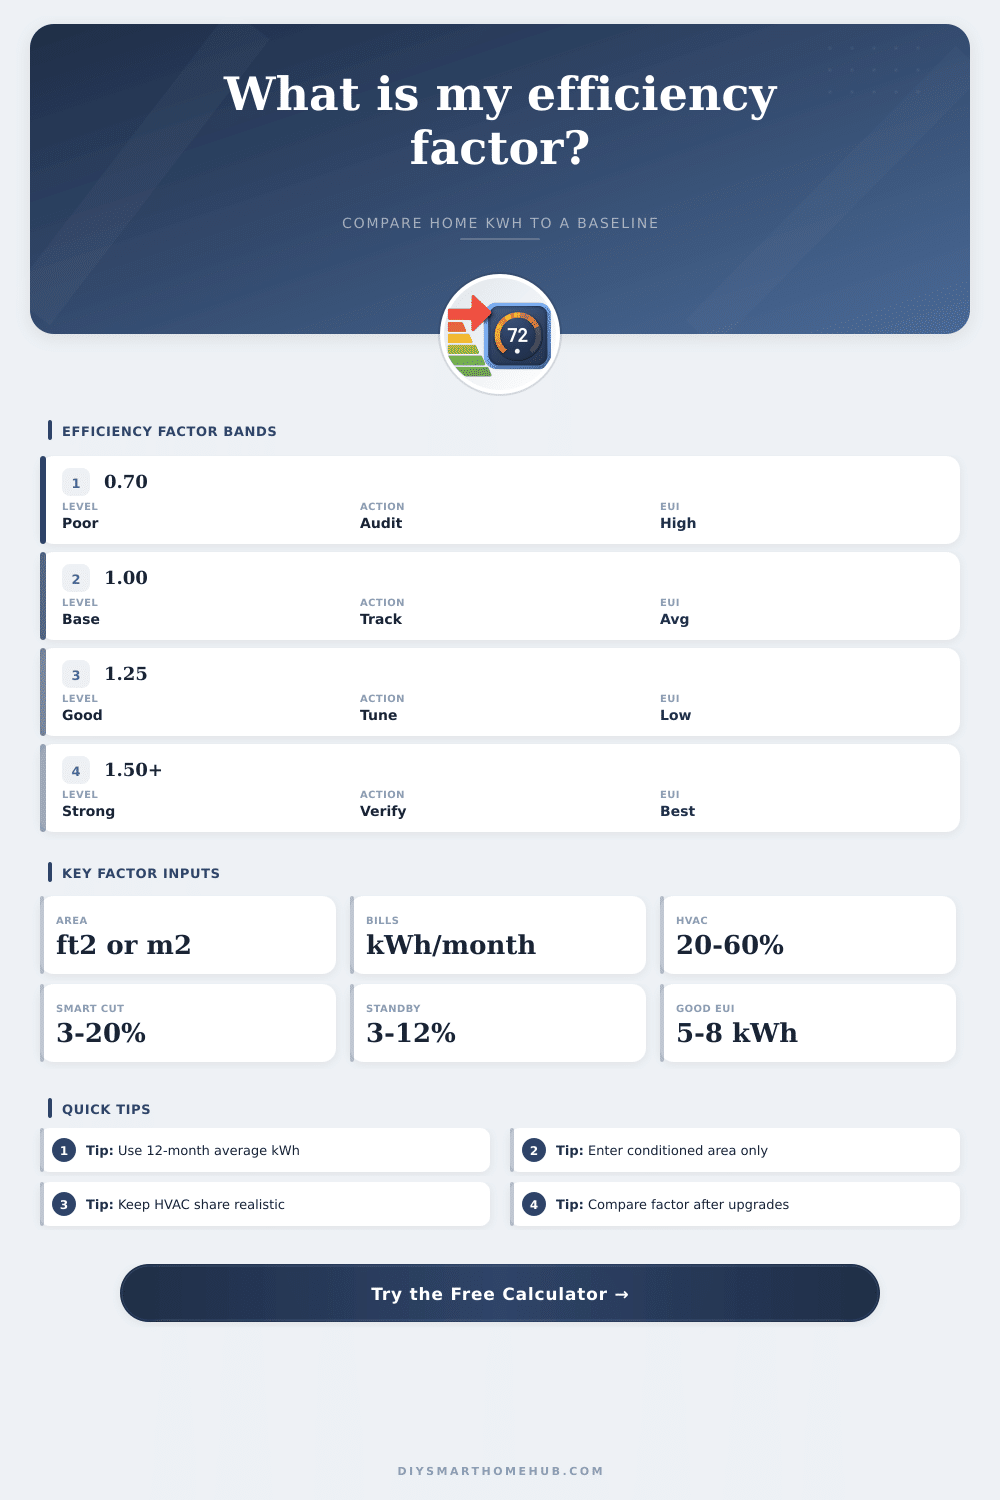
Efficiency Factor Results
🧮Factor Spec Grid
📐Efficiency Factor Reference
| Factor Band | Meaning | Projected Use | What It Usually Indicates |
|---|---|---|---|
| Below 0.85 | Below baseline | More kWh than adjusted baseline | High HVAC, standby, or envelope losses |
| 0.85 to 1.05 | Near baseline | Close to expected use | Normal home with limited optimization |
| 1.06 to 1.30 | Efficient | 6% to 23% below baseline | Good scheduling, LEDs, and controlled loads |
| 1.31 to 1.55 | High efficiency | 24% to 35% below baseline | Strong controls plus efficient equipment |
| Above 1.55 | Very high efficiency | More than 35% below baseline | Low-load shell or verified energy management |
⚡Home Energy Intensity Table
| Annual EUI | Metric Equivalent | Home Pattern | Calculator Interpretation |
|---|---|---|---|
| Under 4 kWh/ft² | Under 43 kWh/m² | Very low electric load | Likely strong factor if comfort is maintained |
| 4 to 6 kWh/ft² | 43 to 65 kWh/m² | Efficient apartment or mild-climate home | Good target range for smart control tuning |
| 6 to 9 kWh/ft² | 65 to 97 kWh/m² | Typical mixed electric home | Baseline factor often lands near 1.0 |
| 9 to 14 kWh/ft² | 97 to 151 kWh/m² | High HVAC or larger plug loads | Controls may help, but shell loads matter |
| Above 14 kWh/ft² | Above 151 kWh/m² | Very high electric intensity | Review HVAC share and continuous loads |
💡Smart Control Reduction Assumptions
| Control Level | HVAC Load Effect | Lighting/Plug Effect | Best Use In Calculator |
|---|---|---|---|
| Manual settings only | 0% | 0% | Current-use baseline comparison |
| Basic schedules | 4% | 3% | Thermostat and lighting schedules |
| Occupancy sensors | 6% | 8% | Rooms with irregular occupancy |
| Adaptive thermostat and lighting | 10% | 12% | Daily learning and daylight response |
| Whole-home energy automation | 14% | 16% | Coordinated thermostat, scenes, and plugs |
| Verified energy management | 18% | 20% | Measured feedback with active optimization |
🏘Common Project Size Benchmarks
| Scenario | Area | Typical kWh/month | Useful Factor Target |
|---|---|---|---|
| Single automated room | 120 to 220 ft² | 35 to 90 | 1.15+ if lighting and plugs are controlled |
| Apartment or condo | 500 to 900 ft² | 280 to 650 | 1.10+ with scheduling and standby control |
| Townhome | 1000 to 1600 ft² | 550 to 1100 | 1.15+ with HVAC and zone controls |
| Whole detached home | 1800 to 2600 ft² | 850 to 1800 | 1.20+ when HVAC share is optimized |
| Large mixed-load home | 2800 to 3800 ft² | 1500 to 2800 | 1.25+ with measured energy management |
ℹCalculation Tips
You may be able to purchase smart thermostat and smart light switches to reduce your energy cost. However, you may find that your electric bill does not go down as a result of these purchase. Many individuals calculates the cost of energy use in terms of the flat monetary cost of that energy use.
However, this figure do not provide information about the efficiency of your homes energy use. To understand the efficiency of your home, you must use the energy efficiency factor instead of focus solely on your electric bill. The energy efficiency factor is a ratio of how much energy your home uses compared to the baseline energy use for your climate zone.
How to Check Your Home’s Energy Efficiency
This ratio can help you to understand whether your home is performing poorly relative to other home of your type in your climate zone. In order to calculate your energy efficiency factor, you must first calculate the conditioned floor area of your home. This figure is the total area of your home that is heated or cool and does not include areas like the garage or attic.
These space are not heated and cooled in the same way as the rest of your home, and if you include these spaces in your calculations, you will artificially inflate your home’s efficiency. In addition to calculating the conditioned floor area of your home, you will also need to use the 12-month average in relation to your electric bill rather than just the electric bill for one month. Using only one month’s electric bill will not reflect your energy efficiency factor accurately, and you will need to use the average electric bill for your entire year.
The energy efficiency factor also incorporates the baseline for your home’s energy efficiency, which change according to the type of home that you own and the climate in which it is located. An energy efficiency calculator adjust for these factors, so you do not have to manually calculate coefficients for these variables. Another factor that the energy efficiency calculator considers is the number of occupant in your home.
The higher the number of occupants of your home, the higher the energy use for tasks like hot water and plug load. By accounting for the number of occupants in your home, the energy efficiency calculator will provide an accurate estimate of the energy use of your home, and you wont incorrectly compare your home to another of a different size or occupancy. Standby load is an energy use that comes from devices that are not currently performing their task but which are still on and using power for tasks like maintaining the screen on a television that is not playing media.
These device, such as coffee makers, DVRs, and computer monitor, can use a significant portion of your electricity bill. By using smart plug to control these devices, you can increase the efficiency factor of your home. The increase in efficiency factor from the reduction in standby loads is likely to be more higher than the efficiency gain that you can generate by changing the type of light bulbs in your home.
Energy efficiency tools often include smart controls to manage the energy use of your home. However, you must also consider the concept of comfort rebound. With comfort rebound, you install energy-efficient gadget into your home to save money on your energy costs.
However, since you have saved money on your energy costs, you may increase the comfort of your living space by increasing the temperature of your home or decreasing its temperature. With an increase in comfort, your energy savings will decrease. Thus, an energy efficiency tool must account for comfort rebound so that it can appropriately reflect the actual energy savings that will result from the installation of energy-efficient technology in your home.
The primary output of an energy efficiency tool or calculator is a figure that represents the energy efficiency of your home in relation to other homes of similar size and type. Specifically, the tool can calculate your Energy Use Intensity, or EUI. The EUI measure the number of kilowatt hours of energy that your home uses per square foot of floor area each year.
The EUI can help you to understand whether your home’s shell is causing your high energy use. An energy use intensity (EUI) that is in the high range of efficiency indicates that you may need to upgrade your home’s shell to increase efficiency. However, if the EUI of your home is in the low range of efficiency, your home shell is likely well-constructed, and you can increase the efficiency of your home by adjusting the automation level of your smart devices.
You can use reference tables to provide an EUI reading of your home that is categorized into ranges that indicate your energy efficiency factor relative to other homes. A reading of your EUI that is below the baseline for efficiency of homes of your size and type indicates that you should investigate air leak in your home rather than purchasing new energy efficiency gadgets for your residence. Finally, by comparing the energy efficiency factor of your home before and after implementing a certain energy efficiency gadget or technology, you can determine whether or not the installation of that technology has provided you with a return on your investment in that purchase.