Audio Streaming Bandwidth Calculator
Estimate live Mbps, daily data, monthly data, and network headroom for smart speakers, audio hubs, lossless receivers, and multiroom playback.
| Audio profile | Typical bitrate | Data per hour | Best fit |
|---|---|---|---|
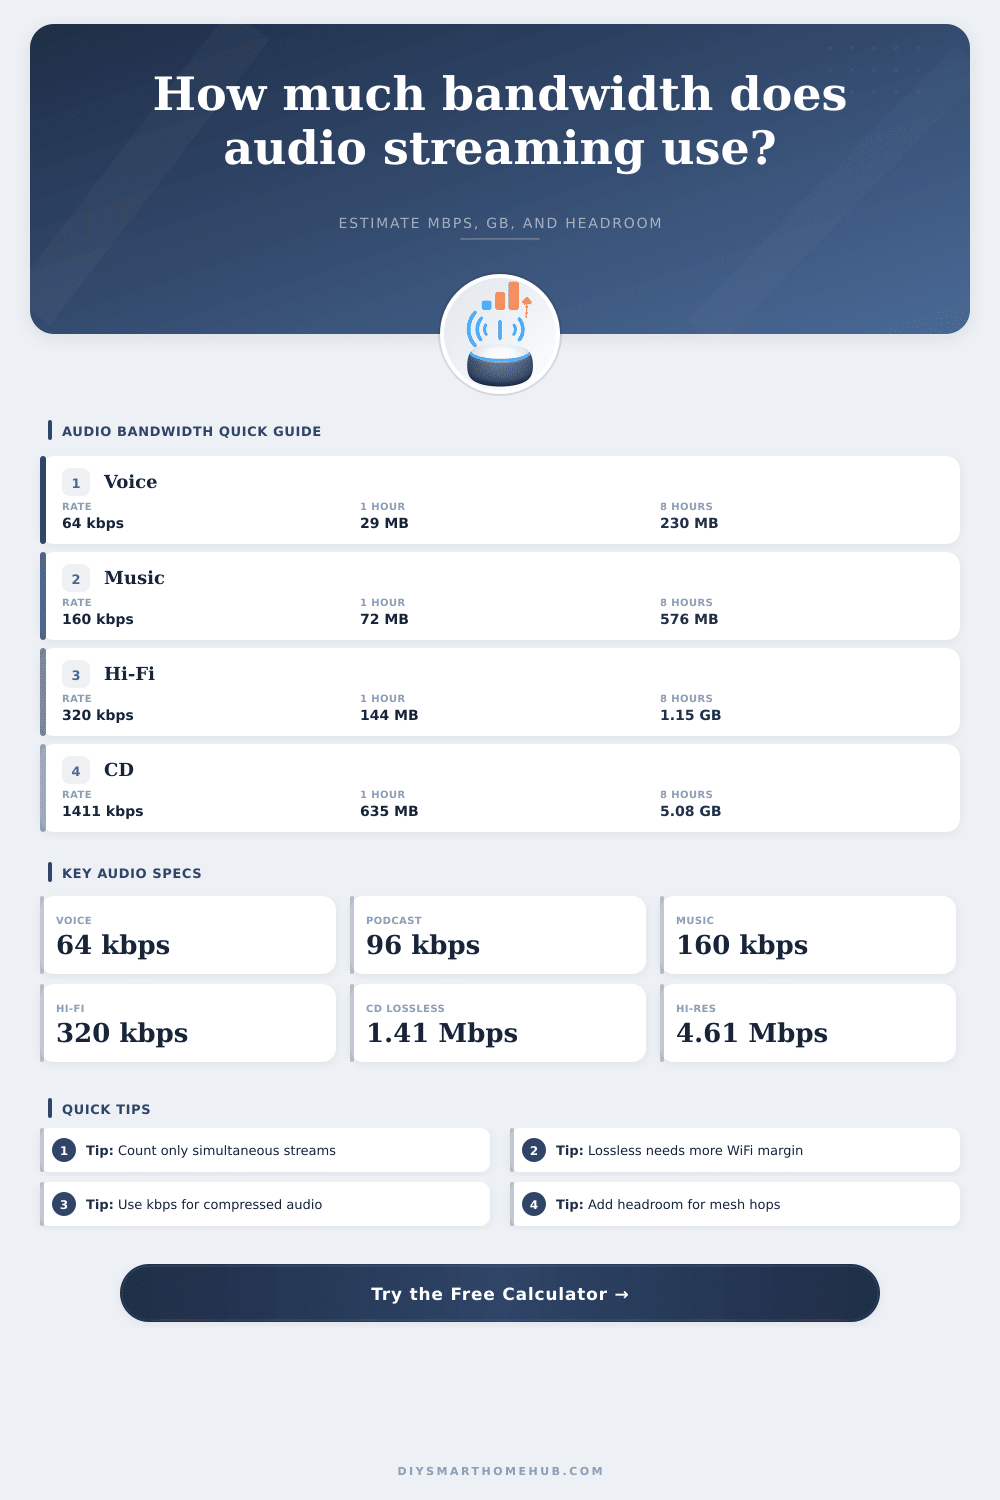
| Voice assistant / intercom | 64 kbps | 28.8 MB | Speech, alerts, low-bandwidth rooms |
| Podcast / talk stream | 96 kbps | 43.2 MB | Spoken-word audio with clear voice |
| Standard compressed music | 160 kbps | 72 MB | Everyday smart speaker playback |
| High quality compressed music | 320 kbps | 144 MB | Hi-fi stereo without lossless data use |
| CD lossless stereo | 1411 kbps | 635 MB | 16-bit / 44.1 kHz lossless rooms |
| Hi-res 24/96 stereo PCM | 4608 kbps | 2.07 GB | Local hi-res or uncompressed streams |
| PCM format | Formula | Bitrate | Data per hour |
|---|---|---|---|
| Mono voice 16/22.05 | 22.05 x 16 x 1 | 353 kbps | 159 MB |
| CD stereo 16/44.1 | 44.1 x 16 x 2 | 1411 kbps | 635 MB |
| Video stereo 24/48 | 48 x 24 x 2 | 2304 kbps | 1.04 GB |
| Hi-res stereo 24/96 | 96 x 24 x 2 | 4608 kbps | 2.07 GB |
| 7.1 cinema 24/48 | 48 x 24 x 8 | 9216 kbps | 4.15 GB |
| Simultaneous streams | 160 kbps music | 320 kbps hi-fi | 1411 kbps lossless |
|---|---|---|---|
| 1 room | 0.20 Mbps with 25% | 0.40 Mbps with 25% | 1.76 Mbps with 25% |
| 3 rooms | 0.60 Mbps with 25% | 1.20 Mbps with 25% | 5.29 Mbps with 25% |
| 6 rooms | 1.20 Mbps with 25% | 2.40 Mbps with 25% | 10.58 Mbps with 25% |
| 8 rooms | 1.60 Mbps with 25% | 3.20 Mbps with 25% | 14.11 Mbps with 25% |
| 12 rooms | 2.40 Mbps with 25% | 4.80 Mbps with 25% | 21.17 Mbps with 25% |
| Daily listening | 160 kbps | 320 kbps | CD lossless |
|---|---|---|---|
| 2 hours / day | 4.38 GB / month | 8.77 GB / month | 38.7 GB / month |
| 4 hours / day | 8.77 GB / month | 17.53 GB / month | 77.3 GB / month |
| 8 hours / day | 17.53 GB / month | 35.07 GB / month | 154.6 GB / month |
| 12 hours / day | 26.30 GB / month | 52.60 GB / month | 231.9 GB / month |
| 24 hours / day | 52.60 GB / month | 105.20 GB / month | 463.8 GB / month |
Audio streaming require network bandwidth to stream audio files over a network. People often assume that audio streaming will work when playing audio files. However, audio streaming can encounter problems when playing multiple audio streams at the same time.
High-resolution audio files requires more bandwidth than compressed audio files because high-resolution files has more data per second. Therefore, if people are playing many audio streams at the same time, the network must travels more data. The calculator display an efficiency number to show the difference between the compressed data and the uncompressed data.
How Much Data Does Audio Streaming Use
The encoded bitrate represent the amount of data that the codec pushes through the network after audio file compression. In contrast, the raw PCM bitrate is the amount of data that would travel over the network if the audio file were not compressed. For example, a track on a CD will have a high bitrate; however, compressed music will have a more lower bitrate.
This efficiency number will help people understand the headroom that the codec have before the signal reaches the router. This will allow people to understand how much compression will reduce the amount of data that the network must use. People must take into consideration the number of simultaneous audio stream.
Each simultaneous audio stream will travel over the network independantly of the others. For example, if a person creates three separate playlists and plays them in three separate locations in the house, the router will have to manage three separate audio streams. The calculator will compute this by taking the bitrate of the audio files and multiplying them by the number of simultaneous streams.
The calculator will also provide an allowance percentage for the total bitrate that the user can play there audio files. A twenty-five percent allowance is the default for the allowance percentage. However, if the audio signal have to travel through walls in the house or if there are other devices connected to the network, the allowance percentage should of be increased.
The calculator also includes the ability to calculate the total amount of data that is used daily and monthly. To calculate the total amount of data that would be used each month, multiply the bitrate by the listening hours that the user wants their speakers to play and then divide by the number of day in a month. These monthly data totals is useful for people who have a data cap on their internet plan.
If a person chooses the highest quality for their audio files, the monthly total will be higher. However, if the person chooses lower quality files, such as podcasts instead of music, the data will be lower. Knowing these two numbers will help people compare the quality of audio files that they can have versus the data that their internet plan will use.
People should monitor the audio files that are being played on their speakers. Audio data might drop when it is traveling through walls, especially if there are other wireless networks in the area. People can use the allowance percentage to even fine-tune the amount of data that the network will drop.
For example, if there are silence gaps in the audio files during peak hours, the user can increase the allowance percentage to allow for additional data to be lost by the network. The number of speakers that are grouped together also play a significant role in the data load over the network. If a person groups their speakers into a zone, the speakers will share one decoded audio feed over the network.
However, if the speakers are playing separate audio files in separate zones, the data that is being sent over the network will multiply. Make sure that the number of simultaneous audio streams that are being played is correctly enter into the calculator to reflect the number of speakers that a person own. The efficiency ratio can help people understand how much the codec is hiding errors in the audio file.
If the efficiency ratio is high, the codec is hiding errors in the audio file that are created through the compression of the audio file. If the efficiency ratio is low, then every problem in the network will be audible in the audio file that is being played on the speakers. The reference tables allow people to compare the quality of different audio profiles.
For example, the reference tables can show the quality of voice audio files as compared with music files of standard quality. These reference tables are not rules, but they are a benchmarks for people to use to decide whether or not the network can handle additional audio files being streamed to speakers around the house. If a person comes close to their data cap, the reference tables can help them decide which audio profile will cost the least amount of data in their data allowance.