Performance of night vision is important in that the performance of night vision will determine whether or not a person is able to distinguish between object in low light levels. A person who is looking at the security camera feed, for instance, may be able to see a blurry shape of an individual passing by the monitored area; the blurry focus of the image indicates the low night vision performance of the surveillance camera. The performance of night vision rely upon the camera’s abilities to focus on objects in low light, as well as the contrast differences between those objects.
One tool that can be used to measure the performance of night vision is a test chart. The test chart include various elements that contribute to measuring the performance of night vision. For instance, the grayscale bar on the test chart can measure the different tones that are visible to the camera in low light; the visibility of these tones at levels similar to starlight can help to determine the camera’s ability to illuminate in low light.
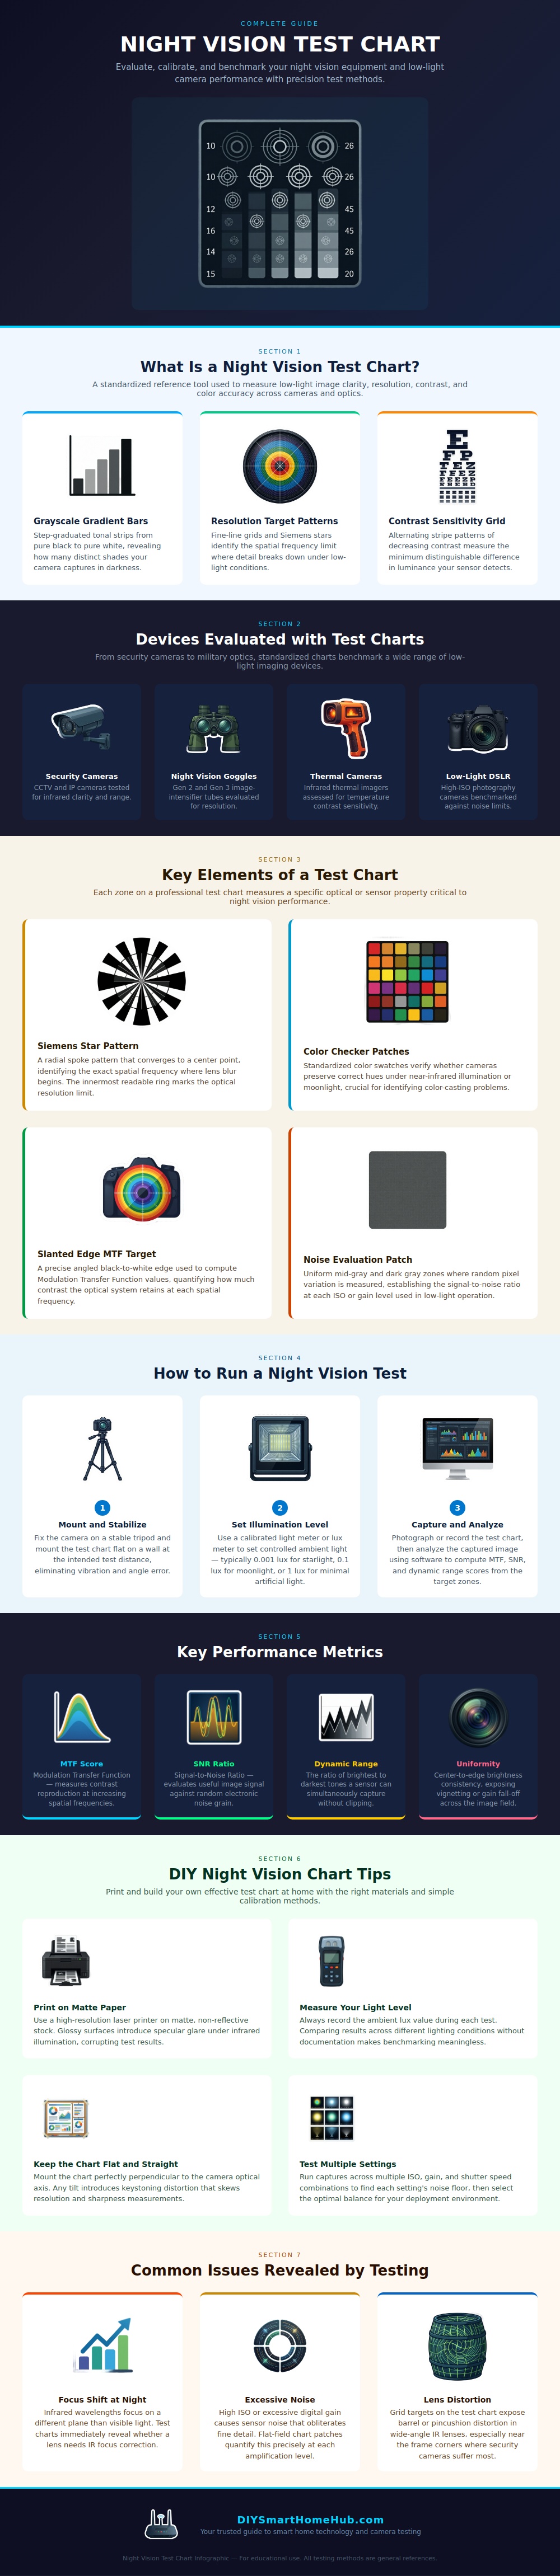
How to Test Night Vision with a Test Chart
Additionally, resolution pattern on the test chart allow for the evaluation of how high the resolution of the camera is; the pattern at which the lines begin to blur together in the image can determine the resolution. Contrast grids on the test chart help to measure the contrast between objects in the image; the smallest differences in brightness that are visible to the camera can be evaluated. Many different types of equipment can include test charts to evaluate their performance in relation to night vision.
For instance, a test chart can evaluate the night vision goggles that people use in outdoor work. Additionally, cameras that detect heat signature, known as thermal cameras, also have a night vision capability that can be evaluated with a test chart. Standard cameras, especially those that utilize high ISO setting, have similar challenges to both night vision goggles and thermal cameras.
Each type of device handles low light in a different than way. In order to evaluate the performance of night vision of the devices, there are some steps that must be followed. First, you must mount the device in a stable position so that the vibrations of the device or the object being viewed do not appear in the record image as poor resolution.
Second, the light levels should be measured during the recording of the test chart; a measurement of the performance of the device at 0.1 lux of light will not be comparable with the performance of the same device at full moonlight. Third, the device should capture the image, after which software can be utilized to calculate the modulation transfer function (MTF) value of the device. These values help to determine at what contrast level of detail the performance of the device begins to weaken; the pattern in the values can indicate whether the device weakens in it’s performance gradually or all at once.
While test charts can be used to evaluate devices according to the specifications of their night vision performance, many people tend to skip to the testing process and instead review the footage that the manufacturers of those devices provide. A review of the manufacturer provided footage, however, will hide any common problem with the device. For instance, the infrared light that is used for night vision may focus on objects at a different distance than visible light; the lens of the device may be focused on objects during the daytime but not during the nighttime.
High digital gain setting for visibility in the dark can lead to noisy images within the recorded video; such noise can be seen when reviewing areas of uniform gray color on the test chart. Finally, any devices with wide-angle lens experience barrel distortion, which may prevent the device from correctly depicting the distance of objects in the recorded video. In addition to purchasing a test chart that can be used to evaluate the performance of the devices’ night vision abilities, it is also possible for the person to construct a test chart themselves.
For instance, the test chart can be printed on matte paper with a laser printer; glossy paper will reflect the infrared light that is used for night vision, leading to false contrast values in the image. Additionally, the test chart must be mounted in a flat fashion to the object being viewed; if the test chart is not mounted in a flat fashion to the object, keystoning can occur. Keystoning may create inaccurate measurement of the performance of the devices night vision capabilities.
Finally, the same scene can be captured with the device at various ISO or gain settings; there is no need to capture the scene with the best setting, but rather to understand the performance of each gain setting. Overall, while no device may excel in every category of night vision performance, the test chart allow for those tradeoffs to become visible to the individual performing the test. After performing the test with the device, the chart can be referenced again if any changes are made to the lenses of the device, the settings of the device, or the lighting in the area being viewed.
Thus, using a test chart allows for the devices performance to remain consistenly and reliable when viewed in various conditions.