WiFi SNR Calculator
Estimate raw SNR, usable SNR, throughput headroom, and reliability margin for smart home WiFi links.
WiFi SNR results
| Usable SNR | Link quality | Smart home fit | What the calculator expects |
|---|---|---|---|
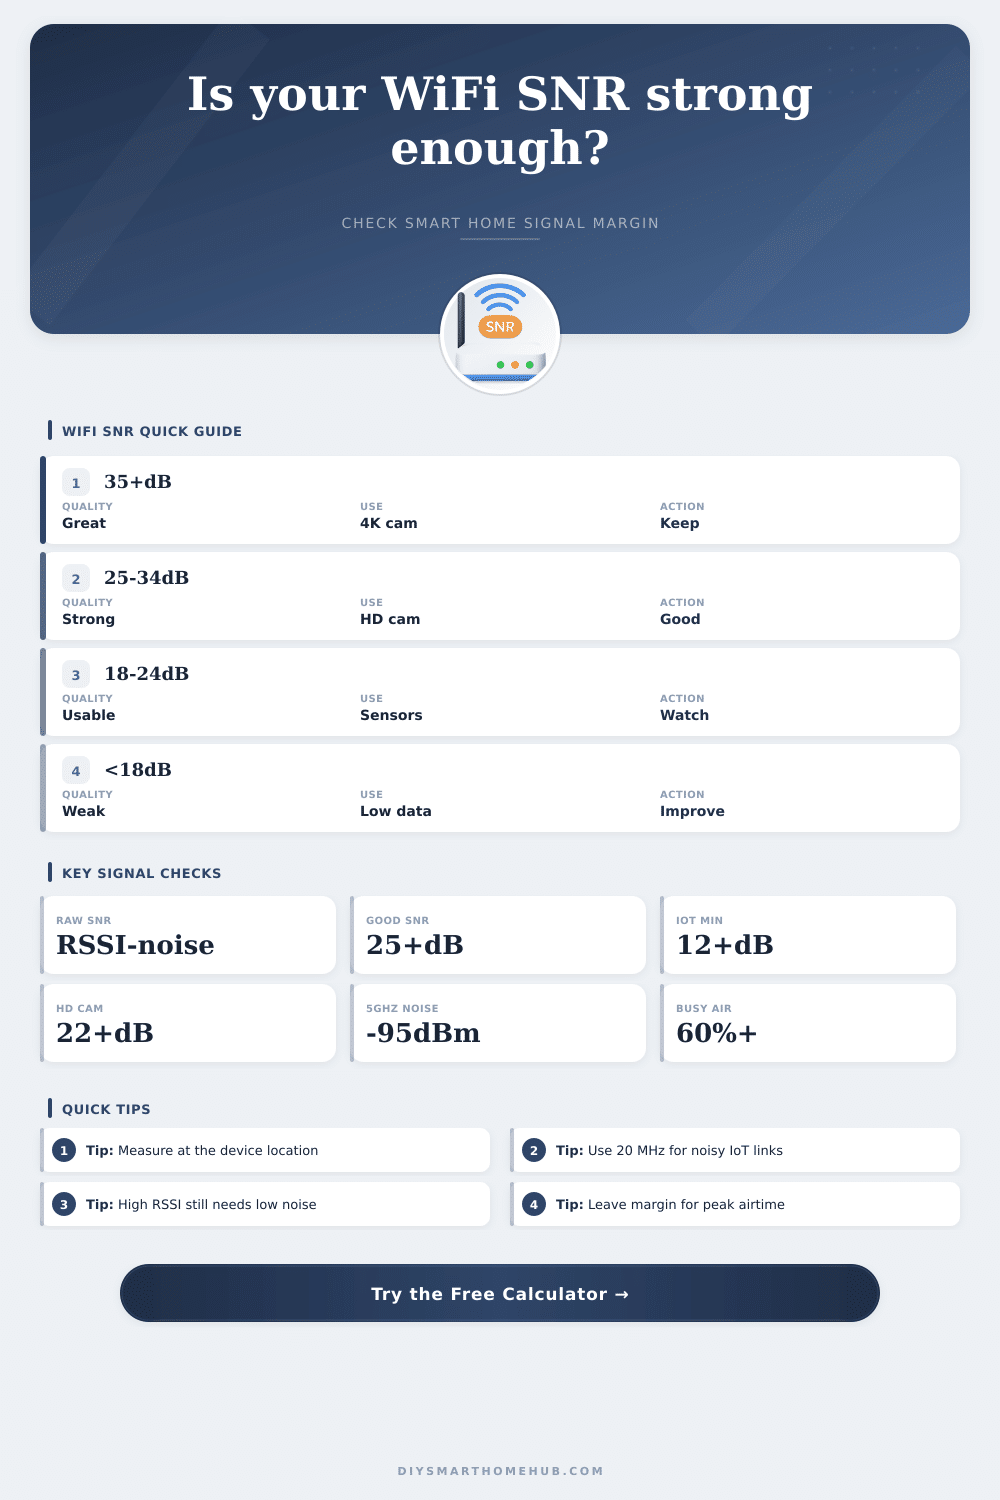
| 35 dB or higher | Excellent | 4K cameras, local backups, low-latency panels | High modulation and strong fade margin |
| 25 to 34 dB | Strong | HD cameras, displays, hubs, voice assistants | Stable throughput with normal household airtime |
| 18 to 24 dB | Usable | Sensors, locks, plugs, light bridges, occasional video | Works better on narrow channels and lower traffic |
| 12 to 17 dB | Marginal | Low-rate IoT only | Small bursts may work, streaming is fragile |
| Below 12 dB | Poor | Not reliable for smart home automation | Noise and retries can dominate the link |
| Band / width | Typical noise floor | Clean-link SNR target | Best smart home use |
|---|---|---|---|
| 2.4 GHz / 20 MHz | -92 to -88 dBm | 18 to 25 dB | Longer reach sensors, locks, plugs |
| 5 GHz / 20 MHz | -98 to -94 dBm | 20 to 28 dB | Stable cameras and hubs in busy homes |
| 5 GHz / 40 MHz | -95 to -91 dBm | 24 to 30 dB | HD camera clusters and touch panels |
| 5 GHz / 80 MHz | -92 to -88 dBm | 28 to 35 dB | High throughput near the access point |
| 6 GHz / 80 MHz | -93 to -89 dBm | 28 to 35 dB | Clean in-room links and modern displays |
| 6 GHz / 160 MHz | -90 to -86 dBm | 32 to 38 dB | Short-range high-throughput automation servers |
| Target use | Required usable SNR | Typical sustained data | Calculation note |
|---|---|---|---|
| Battery sensor or lock | 12 dB | 0.1 Mbps | Low data, but needs margin for wake-up bursts |
| Speaker, hub, or assistant | 18 dB | 1.5 Mbps | Small streams, commands, and cloud keepalives |
| 1080p camera stream | 22 dB | 5 Mbps | Allows bitrate spikes and WiFi retransmits |
| 4K camera stream | 28 dB | 18 Mbps | Needs steady airtime and low adjacent-channel noise |
| Video call or display | 25 dB | 8 Mbps | Latency sensitive when utilization climbs |
| File transfer or local backup | 32 dB | 60 Mbps | Throughput depends heavily on modulation tier |
| Scenario | Starting RSSI / noise | Likely usable SNR | Secondary result |
|---|---|---|---|
| Doorbell camera through exterior wall | -64 / -90 dBm | 18 to 22 dB | HD stream with little spare margin |
| Basement leak sensor on 2.4 GHz | -76 / -91 dBm | 9 to 13 dB | Usable only for brief low-rate messages |
| Apartment AP in open plan room | -50 / -95 dBm | 34 to 39 dB | Strong video and hub headroom |
| Whole home 6E backhaul room-to-room | -58 / -91 dBm | 24 to 30 dB | Good if channel utilization stays moderate |
This calculator estimates link margin from common WiFi planning values. Real throughput varies by chipset, antennas, firmware, roaming behavior, and local interference.
Smart home device rely on the relationship between signal and noise to perform correctly. Many devices will fail if the signal to noise ratio (SNR) is too low. However, the main issue is not with the device at all, but in the fact that someone didnt properly measure the signal to noise ratio for that device.
The difference between a good connection and a bad connection is a small number of decibels. In many cases, those decibels will be ignored until the device fails. The ratio that determines how well the smart home devices will work is called the Signal-to-Noise Ratio, or SNR.
Why Signal to Noise Ratio Matters for Smart Home Devices
SNR describes how strong the signal is compared to the noise on that same frequency. Signal strength alone wont tell you how good the connection is. Strong signal strength will not ensure that the device will work well if there is too much noise in the signal.
The device may struggle to work correctly with a high noise floor. The WiFi calculator take the signal strength and noise floor measurements for the device and subtracts the noise measurement from the signal measurement. The channel load and the signal path makes additional adjustments.
The resulting number is the signal to noise ratio that you can use to plan your smart home network. Distance and obstacles will play a major role in SNR. The farther the signal must travel, or the more physical obstacles stand in the way of the signal from the access point to the device, the less strength the signal will have.
The signal will lose decibels travelling through each physical obstacle. The WiFi calculator creates a reserve for the number of decibels that the signal will lose travelling the distance between the device and the access point with various materials. For example, a sensor may work well next to the router, but the same sensor may not work well when it is mounted in it’s permanent location.
The difference in signal strength between these two locations may seem small, but it may be large enough to make for an unstable signal. The width of the channel that the device use will have an impact on the connection to the router. Channels that are wider will allow for more data speed.
However, a wider channel will have more noise in it than a narrow channel. A 160 MHz channel on the 6 GHz band will allow more data to travel than a 20 MHz channel. However, to maintain that 160 MHz data speed, there will need to be less noise on the channel.
Channels that are narrower will have less data travel than a wide channel. However, they will have less noise on the channel. The WiFi calculator will show how your channel noise and utilization compares to your channel width so that you can make an informed decision about your channel width.
Depending on the function of your smart home device, the SNR will need to be set to a certain level. Devices that require little data, such as a leak detector, can function with a weaker signal. However, a device that requires a lot of airtime to send and receive data will need a higher SNR to ensure it does not stutter in the transmission of that data.
Voice assistants will need a medium SNR. A smart hub will also need a medium SNR. However, if the SNR is too low for these devices, the user will become frustrated with the devices functions.
The target device selector will allow you to set the SNR requirement for each device in the smart home. The level of utilization of the channel will have a large effect on the SNR. If the channel is very busy, devices will struggle to communicate with the access point.
The WiFi calculator will increase the noise floor if the channel utilization is high. High utilization means that devices will have to wait for their turn to use the channel. Once the channel utilization hits 60%, the number of devices on the network will begin to strain the channel.
For many people the strongest signal will be the busiest channel. Thus, moving devices to a different channel will allow more data to travel without strain on the channel. Adjacent-channel energy refers to other devices on the network using the same channel and adding to the noise floor.
Non-WiFi networks use the same bands as WiFi but for other devices. For example, a neighbor’s router may be on the same channel or a cordless phone in the apartment building may be using the 2.4 GHz channel. These devices will add to the noise floor in the channel.
The WiFi calculator can account for the additional noise floor so that the signal to noise ratio reflects the actual conditions of the network. In apartments or tight communities the adjacent channel energy may be high. This will allow people to decide if a device will need its own access point.
The output from the WiFi signal to noise calculator is not a guarantee of performance but only an estimate. The estimate will be based on the common values for each variable in the calculator. Based on the result, you can decide whether you have a comfortable margin of SNR or if you are close to the threshold at which the device will fail.
The actual throughput will depend on the radio bands for each device. The SNR can help people compare SNR at different locations, on different WiFi bands, and on different channel widths. If the SNR for your signal is much higher than the SNR requirement for your device, you can trust that the device will handle network traffic from other smart home devices.
If the SNR for your signal is at or below the SNR requirement for your device, you should look for a better placement for the device or the access point. It is recommended to use the calculator to determine the SNR at the device. The signal should not be measured at the router beside the device.
The real noise floor and utilization on the channel should be entered into the calculator. From these measurements, the calculator will output an SNR that the device can expect to recieve from the network. Based off the usable SNR for your network, you can make informed decisions about device placement or which WiFi bands to use.
You should of used the calculator for more accurate results.