Energy Efficiency Calculator
Estimate how much a smart home efficiency package can reduce monthly kWh, annual intensity, and grid emissions without using price assumptions.
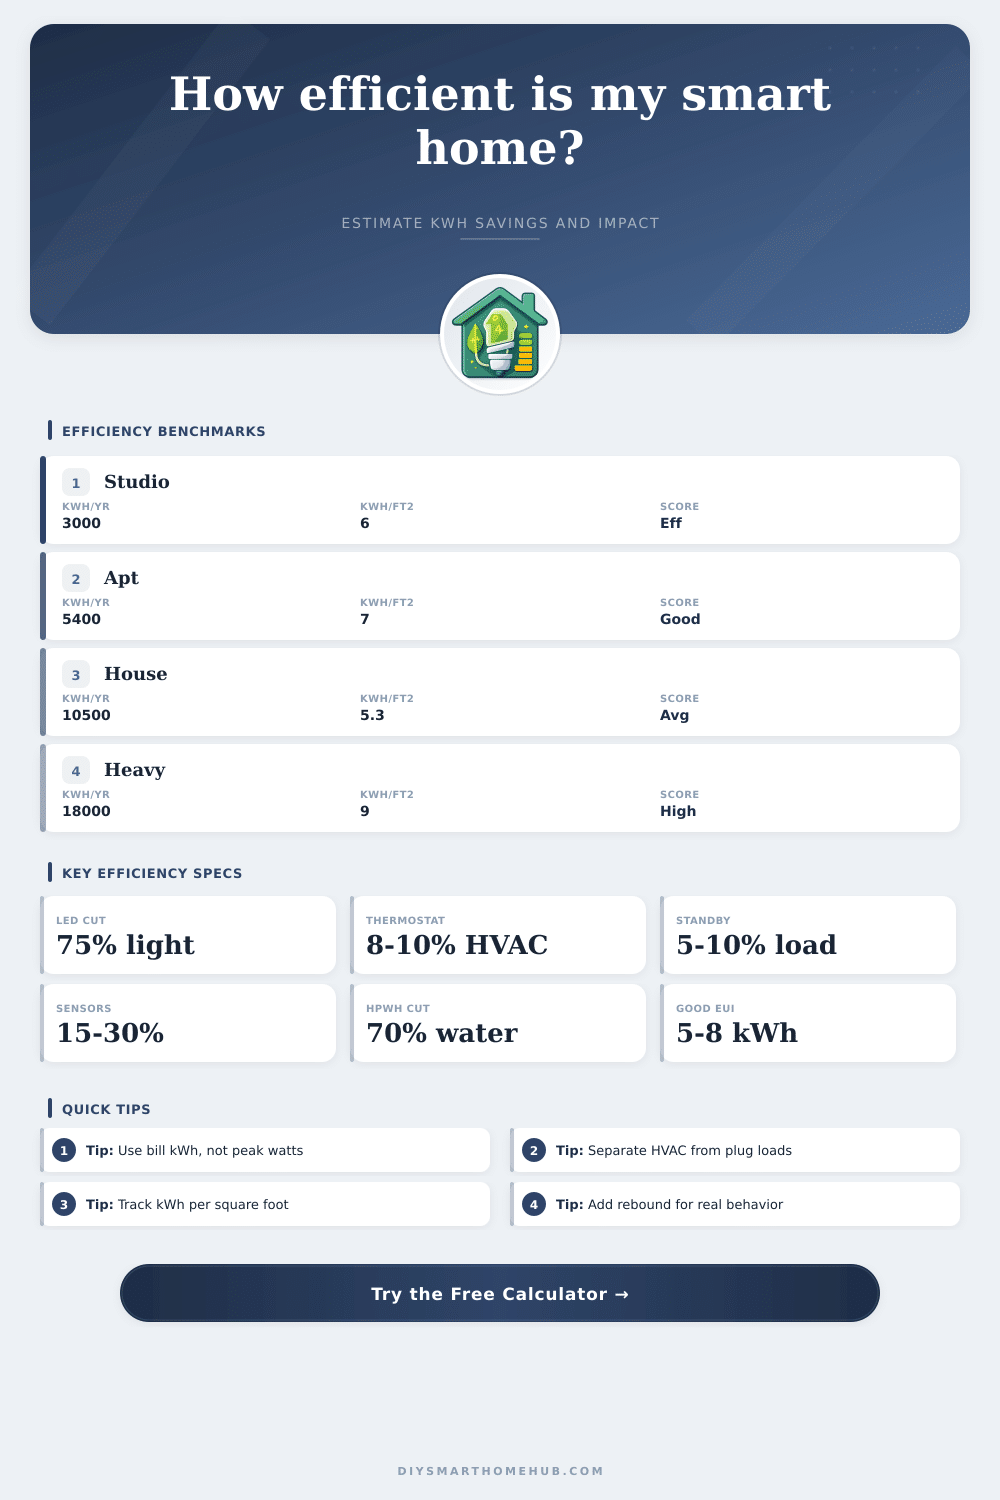
⚙Quick Presets
⌂Home and Energy Inputs
Efficiency Results
Formula Breakdown
▦Smart Efficiency Spec Grid
▤Reference Tables
| Efficiency Measure | Controlled Load | Typical Reduction | Calculator Use |
|---|---|---|---|
| LED smart lighting conversion | Lighting circuits and bulbs | About 75% of lighting energy compared with incandescent lamps | Applies a lighting-share reduction to whole-home kWh |
| Smart thermostat scheduling and setbacks | Heating and cooling load | About 8% heating and 10% cooling reduction under common programs | Scales savings by the HVAC-sensitive load share |
| Smart plugs and standby control | Electronics, idle appliances, always-on devices | Often 5% to 10% of plug and standby energy | Scales savings by plug-load share |
| Occupancy lighting sensors | Intermittent rooms, corridors, garages, utility areas | Often 15% to 30% lighting reduction in controlled spaces | Models targeted lighting load reduction |
| Water heater control logic | Water-heating load | Heat pump water heaters can use about 70% less energy than resistance models | Uses a conservative water-heating share for monthly kWh impact |
| Annual Electric Intensity | kWh per sq ft | kWh per m2 | Interpretation |
|---|---|---|---|
| Very efficient electric use | Under 5 | Under 54 | Low baseline, efficient equipment, or mild climate |
| Efficient range | 5 to 8 | 54 to 86 | Good target for many monitored homes |
| Typical mixed-use range | 8 to 12 | 86 to 129 | Common when HVAC, appliances, and plug loads are all active |
| High electric intensity | 12 to 18 | 129 to 194 | Look for HVAC, water heating, pool, EV, or always-on loads |
| Very high electric intensity | Over 18 | Over 194 | Prioritize submetering and load-by-load verification |
| Load Group | Typical Share | Smart Home Lever | Best Result Metric |
|---|---|---|---|
| Heating and cooling | 35% to 55% | Thermostat control, zoning, runtime tracking | HVAC kWh per degree day |
| Water heating | 12% to 18% | Temperature logic, heat pump water heating, load shifting | Daily water-heater kWh |
| Lighting | 4% to 10% | LED lamps, dimming, occupancy, daylight response | Lighting kWh per room |
| Plug and standby loads | 8% to 20% | Smart plugs, load monitors, standby shutoff rules | Overnight baseline watts |
| Refrigeration and fixed appliances | 5% to 12% | Runtime monitoring and abnormal-use alerts | Daily appliance kWh |
| Common Project Size | Area | Typical Monthly kWh | Useful Efficiency Focus |
|---|---|---|---|
| Single room or home office | 120 to 220 sq ft | 25 to 90 kWh | Plug-load control and occupancy lighting |
| Small apartment | 500 to 850 sq ft | 250 to 650 kWh | Lighting, standby loads, thermostat schedules |
| Garage or workshop zone | 300 to 600 sq ft | 60 to 250 kWh | Task lighting, compressor idle loads, heater runtime |
| Medium detached home | 1500 to 2400 sq ft | 700 to 1300 kWh | HVAC share, water heating, whole-home monitoring |
| High-use all-electric home | 2200 to 3500 sq ft | 1400 to 2600 kWh | HVAC, water heating, EV and pool load separation |
✓Calculation Tips
Electricity bill may appear to be unchangeable and arbitrary cost for many individuals, but electricity bills are based on an energy usage and hardware within the home. Many individual know that there is such a thing as an electric bill, but they do not realize that electric bills are based on the different energy habits and appliance that are within the home at the same time. In order to lower an electric bill, each individual must understand the contribution of the different appliances in the home.
Using the concept of load shares, each individual can determine the percentage of the electric bill that each appliance draw from the homes electricity. Using a calculator, you can utilize these percentages to determine the impact that introducing a specific upgrade to the home may have upon a specific parameter of electric bill. One of the easiest ways to improve the energy efficiency in the home is to improve the energy efficiency of the lighting in the home.
Easy Ways to Lower Your Electricity Bill
Many individuals use energy intensive incandescent light bulbs, which convert the majority of the electric energy to heat energy rather than light energy. Instead, LED bulbs is more efficient at converting electric energy to light energy, and using occupancy sensors will ensure that lights are only on in those area of the home that have individuals within them. Thus, using these two technologies will provide a permanent reduction of baseline electric bill for the home.
Another group of energy-using appliances include those that control the heating and cooling within the home. The climate within the home and the construction of the home can impact the amount of effort that these systems must perform in order to maintain the comfort within the home. Using a smart thermostat will allow for the heating and cooling systems to only perform its tasks when necessary, and to avoid excessive use of those systems.
In climates with extreme temperatures, the heating and cooling systems will draw a large portion of the electricity consumption for the home. Thus, even in climates with mild temperatures, the use of a smart thermostat will create some reduction in the electric bill for the home. One of the more difficult form of electricity use in the home is what is referred to as phantom load.
Phantom load include appliances that are turned off, but which are still plugged into the power outlets in the home, such as televisions, coffee makers, and appliance chargers. Because these appliances are always drawing some amount of power from the outlets in the home, they contribute to the electric bill of the home. Using smart plugs will allow for those appliances to be turned off at the source of their power, reducing the electric bill of the home.
Another major appliance in the home that contribute to the electric bill, though which many individuals are unaware of the electric bill of that appliance is the water heater. The water heater is often the second largest consumer of electricity in the home. To reduce the electric bill of the water heater, the homeowner may convert the water heater to use heat pump technology, or otherwise controlled by smarter logic algorithms.
Though the initial purchase of the water heater is an initial cost for the home that is more greater than that of smart LED bulbs, the water heater will provide the most dramatic reduction in the intensity of electric power that the home uses. One of the counterintuitive concept associated with efficiency is the concept of the rebound effect. The rebound effect suggests that the easier access to energy or the reduction of cost or effort associated with the use of a certain form of energy will lead to an increase in the use of that form of energy.
For instance, if an individual installs an energy-efficient heating system into their home, they may increase the amount of time that they use that system (by heating the home to a higher temperature), which will counteract some of the benefits of the efficiency of that system. Thus, when efficiency is calculated for a home, it is important to account for this rebound effect. Electricity efficiency is achieved by reducing the energy intensity of the home.
The energy intensity of a home can be calculated by measuring the number of kilowatt hours that the home use per square foot of the home. This measure can be utilized to compare the energy efficiency of an individual’s home to other homes of similar size. Additionally, the energy intensity of a home can be multiplied by the emissions factor of the electric grid to determine the environmental impact of the homes electric usage.
Thus, efficiency can be achieved by addressing each of these different aspect of a homes electricity use, from the smallest device to the largest. Once the individual determines the load shares of each appliance in the home, the individual can manage the home through the simple mathematics of load shares.