💧 Water Carbon Footprint Calculator
Calculate the CO₂ emissions from your daily water use activities — showers, laundry, dishwashing & more
| Duration | Standard (8 L/min) | Power (12 L/min) | Low-Flow (5 L/min) | Annual CO₂ (Standard) |
|---|---|---|---|---|
| 4 minutes | 9.6 g CO₂ | 14.4 g CO₂ | 6.0 g CO₂ | 3.5 kg/yr |
| 6 minutes | 14.4 g CO₂ | 21.6 g CO₂ | 9.0 g CO₂ | 5.3 kg/yr |
| 8 minutes | 19.2 g CO₂ | 28.8 g CO₂ | 12.0 g CO₂ | 7.0 kg/yr |
| 10 minutes | 24.0 g CO₂ | 36.0 g CO₂ | 15.0 g CO₂ | 8.8 kg/yr |
| 15 minutes | 36.0 g CO₂ | 54.0 g CO₂ | 22.5 g CO₂ | 13.1 kg/yr |
| 20 minutes | 48.0 g CO₂ | 72.0 g CO₂ | 30.0 g CO₂ | 17.5 kg/yr |
| Temperature | Water Used | CO₂ per Cycle | Weekly (4 cycles) | Annual CO₂ |
|---|---|---|---|---|
| Cold / 20°C | 50 L | 1.7 g | 6.8 g | 0.35 kg/yr |
| Warm / 40°C | 50 L | 15.0 g | 60 g | 3.1 kg/yr |
| Hot / 60°C | 50 L | 30.0 g | 120 g | 6.2 kg/yr |
| Very Hot / 90°C | 50 L | 52.5 g | 210 g | 10.9 kg/yr |
| Household Type | People | Annual Water (L) | CO₂ from Water (kg) | % of Avg Footprint |
|---|---|---|---|---|
| Eco Single Person | 1 | 25,000 L | 8 – 12 kg | 0.3% |
| Average Single | 1 | 55,000 L | 18 – 28 kg | 0.7% |
| Average Couple | 2 | 100,000 L | 35 – 55 kg | 1.3% |
| Family of 3 | 3 | 145,000 L | 50 – 75 kg | 1.8% |
| Family of 4 | 4 | 185,000 L | 65 – 95 kg | 2.3% |
| Large Family (5+) | 5+ | 230,000+ L | 80 – 120+ kg | 2.9% |
| High-Use Household | 4 | 280,000 L | 95 – 140 kg | 3.5% |
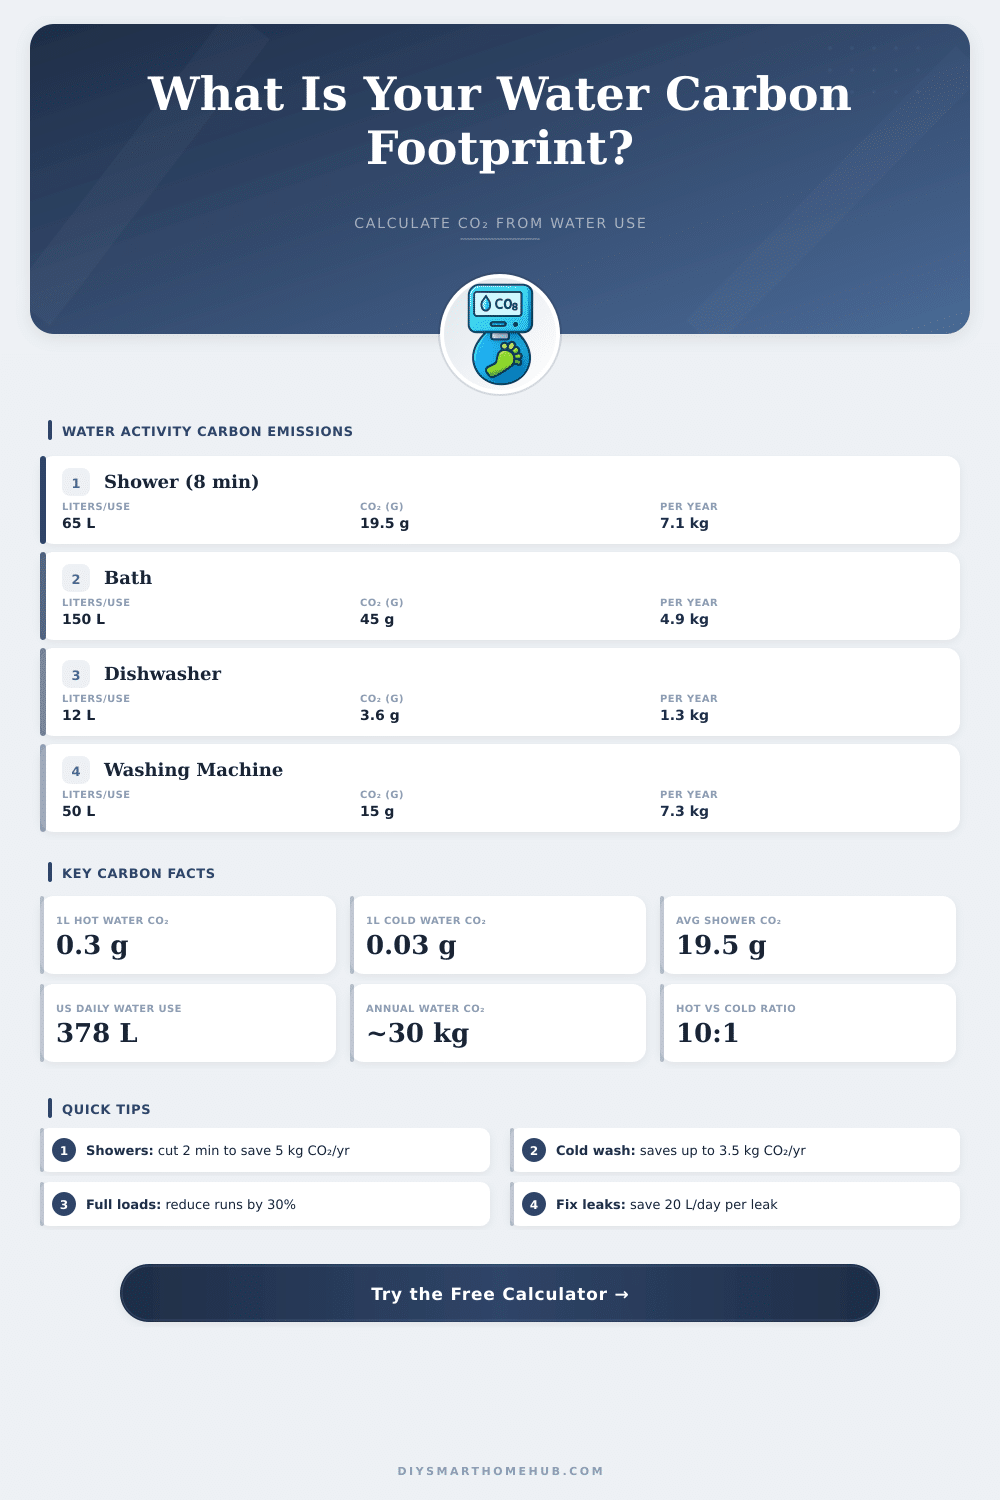
| Heating Method | CO₂ per Liter Hot | Annual Shower CO₂ (8min/day) | Vs. Gas Baseline |
|---|---|---|---|
| Natural Gas Boiler | 0.300 kg/m³ | 7.0 kg/yr | Baseline |
| Electric (Grid Avg) | 0.190 kg/m³ | 4.5 kg/yr | –36% |
| Heat Pump Water Heater | 0.060 kg/m³ | 1.4 kg/yr | –80% |
| Electric (Renewable) | 0.020 kg/m³ | 0.5 kg/yr | –93% |
| Solar Water Heater | 0.010 kg/m³ | 0.2 kg/yr | –97% |
Water does not seem to add to carbon footprint issues, but here is the key problem: getting water to our homes and businesses needs a lot of energy. Pumping it, cleaning it and moving it through long distances. All of that burns fossil fuels.
This becomes more and more serious, because the need for water always grows, and we simply can not live without it.
How Water Use Raises Our Carbon Footprint
For every cubic metre of water that we use, we must think about around 10 to 15 kilos of carbon footprint issues. Another way to say that: it matches to about 85 pounds of CO2 for every 1 000 gallons. The typical American uses around 2 000 gallons monthly, what results in 2,5 to 3,5 kilos of CO2 each person.
The source of the water makes a big difference. The process of cleaning itself; you know, to make it safe to drink. Creates between 0,18 and 0,79 kilos of CO2 per cubic metre, depending on the source.
Surface water is much beter in this area. Groundwater? Here is the real energy drain, because pumping it from the ground needs huge work.
Here is where it gets exciting: huge amounts of energy go into the whole water cycle, providing, cleaning and finally using it home or at work. So, if we focus on strict saving of water, we at the same time reduce energy use and carbon footprint issues. Across the whole land, the water systems are real energy drains.
Understanding that tie between carbon and water could really change how we care about resources and make laws.
Bottled water only makes the problem worse. Whether about those plastic bottles for single use or the big 5-gallon jugs, that arrive to your door, the carbon footprint is huge. The making of plastic, the moving bye means of trucks, all this adds up.
Switching to a reusable bottle, one really cuts plastic use and lowers your own carbon footprint.
The use of water at home has bigger impact, than many folks think. Heating, for instance, carries a surprisingly heavy carbon footprint. Even so, here are simple wins.
Shorter showers, turning down the water heater, putting in low-flow devices… That does not need big changes. Less heated water means less burned energy, whatsimply removes a chip from your personal carbon footprint.
The idea of carbon footprint appeared around 2005, although it never really spread without full agreement about one single scientific explanation. The idea of water footprint followed closely starting around 2008. Those methods help to measure the environmental impacts side by side, but they are not perfect.
Carbon footprint calculations commonly skip water use and problems with dirty water entirely. On the other hand, paying attention to how much water we use, and how we save, really is one of the most easy things to lower carbon footprint issues.