🌱 Food Carbon Footprint Calculator
Estimate the CO₂ emissions from your weekly diet. Enter your food consumption to see your environmental impact.
| Diet Type | kg CO₂e / Year | lbs CO₂e / Year | % vs Average | Equivalent Driving (km) |
|---|---|---|---|---|
| Heavy Meat Eater | 3,300 | 7,275 | +57% | ~18,900 km |
| Average Western Diet | 2,100 | 4,630 | Baseline | ~12,000 km |
| Flexitarian | 1,700 | 3,750 | –19% | ~9,700 km |
| Pescatarian | 1,500 | 3,310 | –29% | ~8,600 km |
| Mediterranean | 1,400 | 3,090 | –33% | ~8,000 km |
| Vegetarian | 1,200 | 2,650 | –43% | ~6,900 km |
| Vegan | 700 | 1,545 | –67% | ~4,000 km |
| Food Item | Typical Serving | CO₂ per Serving (kg) | CO₂ per Serving (lbs) | Annual Impact (daily serving) |
|---|---|---|---|---|
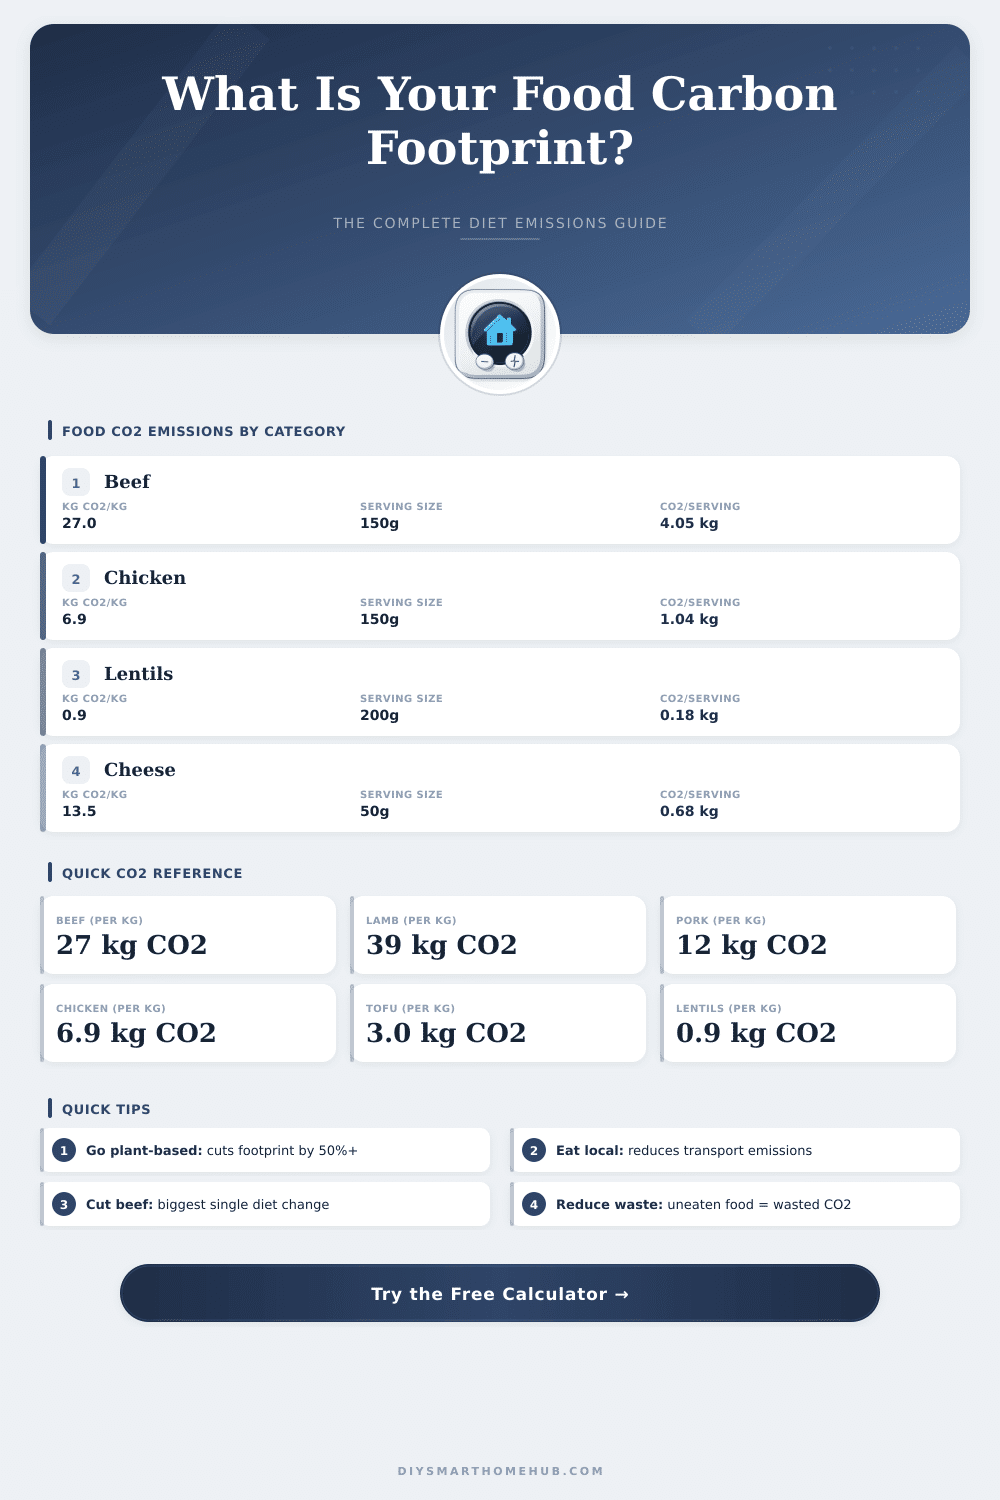
| Beef steak | 150g / 5.3 oz | 4.05 | 8.9 | 1,478 kg/yr |
| Lamb chop | 130g / 4.6 oz | 5.10 | 11.2 | 1,860 kg/yr |
| Pork chop | 150g / 5.3 oz | 1.82 | 4.0 | 663 kg/yr |
| Chicken breast | 150g / 5.3 oz | 1.04 | 2.3 | 379 kg/yr |
| Salmon fillet | 150g / 5.3 oz | 0.77 | 1.7 | 280 kg/yr |
| 2 Eggs | 100g / 3.5 oz | 0.32 | 0.7 | 117 kg/yr |
| Glass of milk | 250ml / 8.5 oz | 0.64 | 1.4 | 234 kg/yr |
| Cheese slice | 40g / 1.4 oz | 0.54 | 1.2 | 197 kg/yr |
| Tofu portion | 150g / 5.3 oz | 0.45 | 1.0 | 164 kg/yr |
| Lentil serving | 200g / 7 oz | 0.18 | 0.4 | 66 kg/yr |
| Cup of coffee | 7g / 0.25 oz | 0.12 | 0.26 | 44 kg/yr |
| CO₂ Amount | In lbs | Equivalent Activity | Trees Needed to Offset (1 yr) |
|---|---|---|---|
| 100 kg CO₂ | 220 lbs | Drive ~580 km / 360 mi | 5 trees |
| 500 kg CO₂ | 1,102 lbs | Drive ~2,900 km / 1,800 mi | 25 trees |
| 1,000 kg CO₂ | 2,205 lbs | 1 short-haul flight | 50 trees |
| 2,100 kg CO₂ | 4,630 lbs | Avg. diet footprint/yr | 105 trees |
| 5,000 kg CO₂ | 11,025 lbs | 1 transatlantic flight | 250 trees |
The food that we eat has a bigger effect on the climate than almost everything else. The global food systems report about 25-30% of the emissions, and because of a growing population that eats more meat and throws away more food we risk going past the carbon limits meant to control the warming. Even so, there are real changes that can help.
What some choose to eat matters more than the origin of the product. Beef has the same heavy carbon footprint, regardless of the place where the meat grew. The transport is not the main part of food emissions.
How Food Affects the Climate
A good example is shown by avocados. Sending one kilo from Mexico to the United Kingdom, one creates around 0.21 kg of CO2 because of transport emissions. That is only about 8% of the whole carbon footprint for those avocados.
Only few foods travel by plane, around 0.16% of all food miles. Even so, if one uses air for shipping, the emissions become huge. Air transport creates 50 tiems more CO2 than shipping for the same distance.
On average, beef and lamb have the highest carbon footprint between all foods. Meat, cheese and eggs stand at the top also. Eating one kilo of beef, one creates emissions equal to a journey of 63 miles by car.
On the other hand, fruits, grains and vegetables have the lowest carbon footprint, then come nuts and beans. To get 100 grams of protein from peas, the emissions are only 0.4 kg of CO2, almost 90 times less than for same protein from beef.
Shrimp and palms carry a big carbon footprint also. The main cause is that one destroys mangroves too create shrimp farms, releasing stored carbon into the air. Dinner from steak and shrimp on former mangrove ground matches in carbon a journey by little car through the whole United States.
Making meat reports about direct emissions from farm work and about the loss of natural carbon storage. Plant based foods like beans, peas, nuts, lentils, fruits and vegetables normally use less energy, land and water. They also have lower levels of greenhouse gases than those based on animals.
Switching to a plant based diet could cut the needed land for food production by around 75%.
Waste of food is another big problem. It reports about around 8% of global emissions. Almost five times more than flying.
Packaging matters also. It can add more than ten percent to the emissions of a product. Oddly, plastic containers sometimes have a smaller carbon footprint than glass ones, if one includes making andmoving them.
Switching to healthier, more plant based diets and cutting waste of food could feed the same people with less production and a smaller carbon footprint. The carbon footprint of food is measured by Life Cycle Analysis, that follows the environmental impacts through the whole life cycle of a product.