Indoor Air Quality Calculator
Score a room from smart sensor readings for CO2, PM2.5, TVOC, relative humidity, temperature, and outdoor-air ventilation using a weighted IAQ model.
⚙Real indoor air presets
📏Room and sensor inputs
Indoor air quality result
📊Live IAQ weighting grid
📘IAQ score band reference
| Weighted score | Band | Typical room condition | Calculation meaning |
|---|---|---|---|
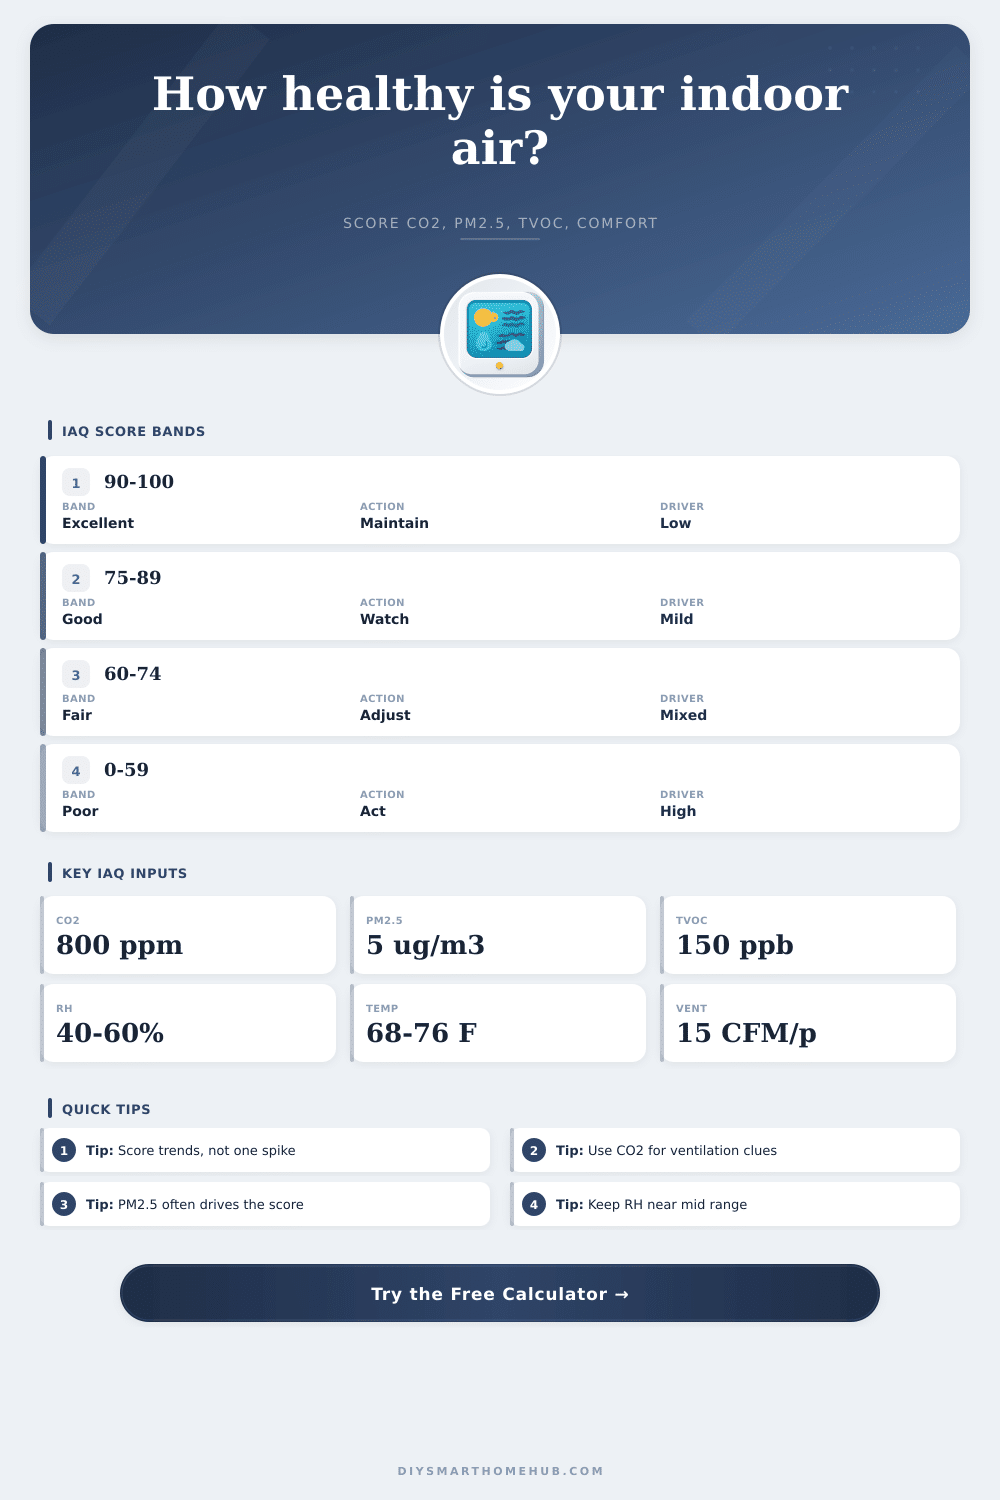
| 90 to 100 | Excellent | Low pollutants, stable comfort, adequate outdoor air | All major penalty ratios are small. |
| 75 to 89 | Good | One mild driver or light ventilation shortfall | Good daily operation with a factor worth watching. |
| 60 to 74 | Fair | Multiple moderate drivers or one strong driver | Weighted penalties are large enough to change controls. |
| 40 to 59 | Poor | High particles, VOCs, CO2, dampness, or heat stress | Dominant penalty is likely obvious in the factor list. |
| 0 to 39 | Very poor | Severe pollutant or ventilation profile | Several weighted factors are near their maximum penalty. |
🌡Input threshold table
| Factor | Low penalty zone | Moderate penalty zone | High penalty zone |
|---|---|---|---|
| CO2 | Under 800 ppm | 800 to 1200 ppm | Above 1200 ppm, max near 2000 ppm |
| PM2.5 | 0 to 5 ug/m3 | 5.1 to 15 ug/m3 | Above 15 ug/m3, max near 55 ug/m3 |
| TVOC | 0 to 150 ppb | 151 to 500 ppb | Above 500 ppb, max near 1000 ppb |
| Relative humidity | 40% to 60% | 30% to 40% or 60% to 70% | Below 30% or above 70% |
| Temperature | 68 to 76 F | 60 to 68 F or 76 to 82 F | Outside 60 to 82 F |
| Ventilation | At or above target | 50% to 99% of target | Below 50% of target |
🔧Sensor/spec comparison grid
| Sensor channel | Common spec | Strength | IAQ scoring caution |
|---|---|---|---|
| CO2 NDIR | Plus or minus 30 to 75 ppm | Ventilation proxy for occupied rooms | Baseline drift changes the ventilation reading. |
| PM2.5 laser | 0 to 500 ug/m3 range | Strong for smoke, cooking, and dust trends | Humidity and particle type can skew mass estimates. |
| TVOC MOS | 0 to 2000 ppb range | Useful for source events and decay curves | Cross-sensitive; not a compound-specific test. |
| RH capacitive | Plus or minus 2% to 5% RH | Comfort, mold-risk, and particle behavior context | Sensor placement near vents can distort the room average. |
| Temperature | Plus or minus 0.5 to 1.0 F | Comfort and ventilation effectiveness context | Radiant heat and sunlight can bias small enclosures. |
| Airflow estimate | CFM, ACH, or per-person rate | Connects IAQ readings to outdoor-air dilution | Total fan airflow is not the same as outdoor air. |
🏠Common room profiles
| Room profile | Typical area | Watch first | Useful sensor mix |
|---|---|---|---|
| Bedroom overnight | 120 to 220 ft2 | CO2 and RH drift | CO2, RH, temperature |
| Kitchen and dining | 180 to 400 ft2 | PM2.5 and TVOC spikes | PM2.5, TVOC, CO2 |
| Home office | 90 to 180 ft2 | CO2 buildup | CO2, temperature, RH |
| Basement room | 250 to 700 ft2 | Humidity and VOC persistence | RH, TVOC, PM2.5 |
| Garage-adjacent entry | 60 to 160 ft2 | TVOC and particles | TVOC, PM2.5, CO2 |
| Workshop | 150 to 500 ft2 | Dust loading | PM2.5, RH, ventilation |
Indoor air quality isnt a single measurement of indoor air quality, but rather the result of several different factors that interacts with each other. Factors that influence indoor air quality include carbon dioxide level, fine particle levels, volatile organic compound levels, humidity, temperature, and the rate at which outdoor air is introduced into the indoor space. Each of these factors influence each of the other factors; for instance, humidity can impact particle behavior in the air, and inadequate ventilation can contribute to high levels of carbon dioxide and volatile organic compounds in the indoor space.
The calculator that this article introduces can help to provide a weighted calculation of these different factors, so that individuals does not have to perform the math themselfs to calculate indoor air quality. Carbon dioxide is one of the most significant factors in measuring indoor air quality. High levels of carbon dioxide within an indoor space indicate that the indoor space is inadequately ventilated for the number of individuals that are present within the space.
What Affects Indoor Air Quality and How the Calculator Helps
High levels of carbon dioxide indicate that other pollutants will also linger within the space. However, carbon dioxide levels do not indicate the source of the poor indoor air quality; for instance, carbon dioxide levels cannot indicate if the indoor air quality is poor due to cooking activities, or if the indoor air quality is poor due to volatile organic compounds from furniture within the space. Individual must consider each of the sensor measurements within the space to determine which factor is adversely impacting indoor air quality within that space.
Fine particles, also known as PM2.5, is another factor that can contribute to poor indoor air quality. Fine particles move differently within the indoor space than the gases within that space, and tend to settle within the indoor space at a slower rate than the gases within that space. Fine particles can be introduced into indoor spaces during activities like cooking, from candles within the space, or from smoke that enters the indoor space from outdoors.
Because PM2.5 can have such a large impact upon indoor air quality, the model introduces a relatively high weight for fine particles in the calculation of indoor air quality. The model does not deemphasize the other factors, but fine particles are difficult to ignore when they are present in the air within an indoor space. Humidity and temperature introduce another layer of complexity to indoor air quality.
For instance, indoor air quality that is too dry may lead to irritation of the airways of the individuals within the space, and it may cause the particles within the indoor space to remain suspended from the air. Indoor air quality that contains too much humidity can lead to the growth of microbe within the indoor space, as well as lead to inaccurate sensor measurements. Finally, indoor air quality also considers the impact of temperature within the space; temperature can impact the feeling of the indoor space of the individuals within the space.
Each of these variable is considered within the model to determine indoor air quality. In addition to each of the factors that impact indoor air quality, the model also considers the factor of ventilation as the primary factor that relates to each of the other factors. For instance, the model calculates a target rate of ventilation for the indoor space based off the size of the indoor space and the number of individuals that are within that space.
Small indoor spaces may have fewer individuals within them than large indoor space, and vice versa. The model calculates indoor air quality within the model based upon whether the rate of outdoor air ventilation is below the target rate of ventilation; the more that the outdoor air ventilation is below the target rate, the lower the indoor air quality score. In addition to calculating indoor air quality based upon factors related to outdoor air ventilation, the indoor air quality model also determines if carbon dioxide levels are high within the indoor space, because high levels of carbon dioxide indicate that outdoor air ventilation within the indoor space is not occurring as it should.
Outdoor air quality scores should not be made based upon a single air quality measurement. For instance, an individual may measure high levels of PM2.5 and VOCs after performed cooking activities within the indoor space; however, those high levels are temporary, and do not necessarily indicate poor indoor air quality. Additionally, high levels of carbon dioxide may be measured throughout the day that an individual spends within a space, while levels of PM2.5 and VOCs may remain relatively stable.
Therefore, the model provides indoor air quality scores only as a snapshot of the air quality within an indoor space, and must be measured during different time of the day to recognize trends in indoor air quality. Finally, while any of the factors related to ventilation do not influence indoor air quality calculations, there are other factors that may impact indoor air quality measurements. For instance, different zone within the same indoor space have different requirements for indoor air quality; bedrooms may have different requirements than kitchens that are used to prepare food.
Additionally, sensors may be placed in different areas within a large indoor space; sensors may be placed near an exterior door of the space, while other sensors may be placed in the middle of the indoor space. These factors do not influence the indoor air quality calculations, but do have an impact upon the individual understanding of the measurements that are provided by the calculator. Each of the tables that are provided as a part of the indoor air quality model show the various zones that are defined as having low indoor air quality, moderate indoor air quality, high indoor air quality, or excellent indoor air quality.
Each of the zones indicate indoor air quality is moving from one level to another; the tables exist to provide indoor managers with an understanding of which factor within the indoor space is adversely impacting indoor air quality. Thus, the calculations that are provided as an output of the indoor air quality model help the indoor manager to determine whether the indoor space needs to increase its airflow level, or if it needs to address another source of pollution within that space. One of the most useful outcomes of the indoor air quality model is to help individuals understand indoor air quality trends over time.
If certain indoor spaces consistently maintain indoor air quality within the “good” range, then the indoor air quality is managed appropriately. However, if indoor air quality scores are low within certain areas of an indoor space, especially when the number of individuals within those areas increases, then the indoor air quality management for those spaces may need to be adjusted. Therefore, the indoor air quality calculator allows for indoor managers to track indoor air quality over time.
Thus, the goal of creating this indoor air quality model and calculator is to allow indoor managers to understand which factors impact indoor air quality, and to take action to counteract those factor.