AQI to Cigarettes Calculator
Convert PM2.5 AQI or concentration into a cigarette-equivalent exposure estimate using EPA PM2.5 breakpoints and the Berkeley Earth 22 micrograms per cubic meter per day rule of thumb.
🎯Real Air Quality Presets
⚙AQI, PM2.5, And Exposure Inputs
📊Current Exposure Snapshot
📘PM2.5 AQI Conversion Reference
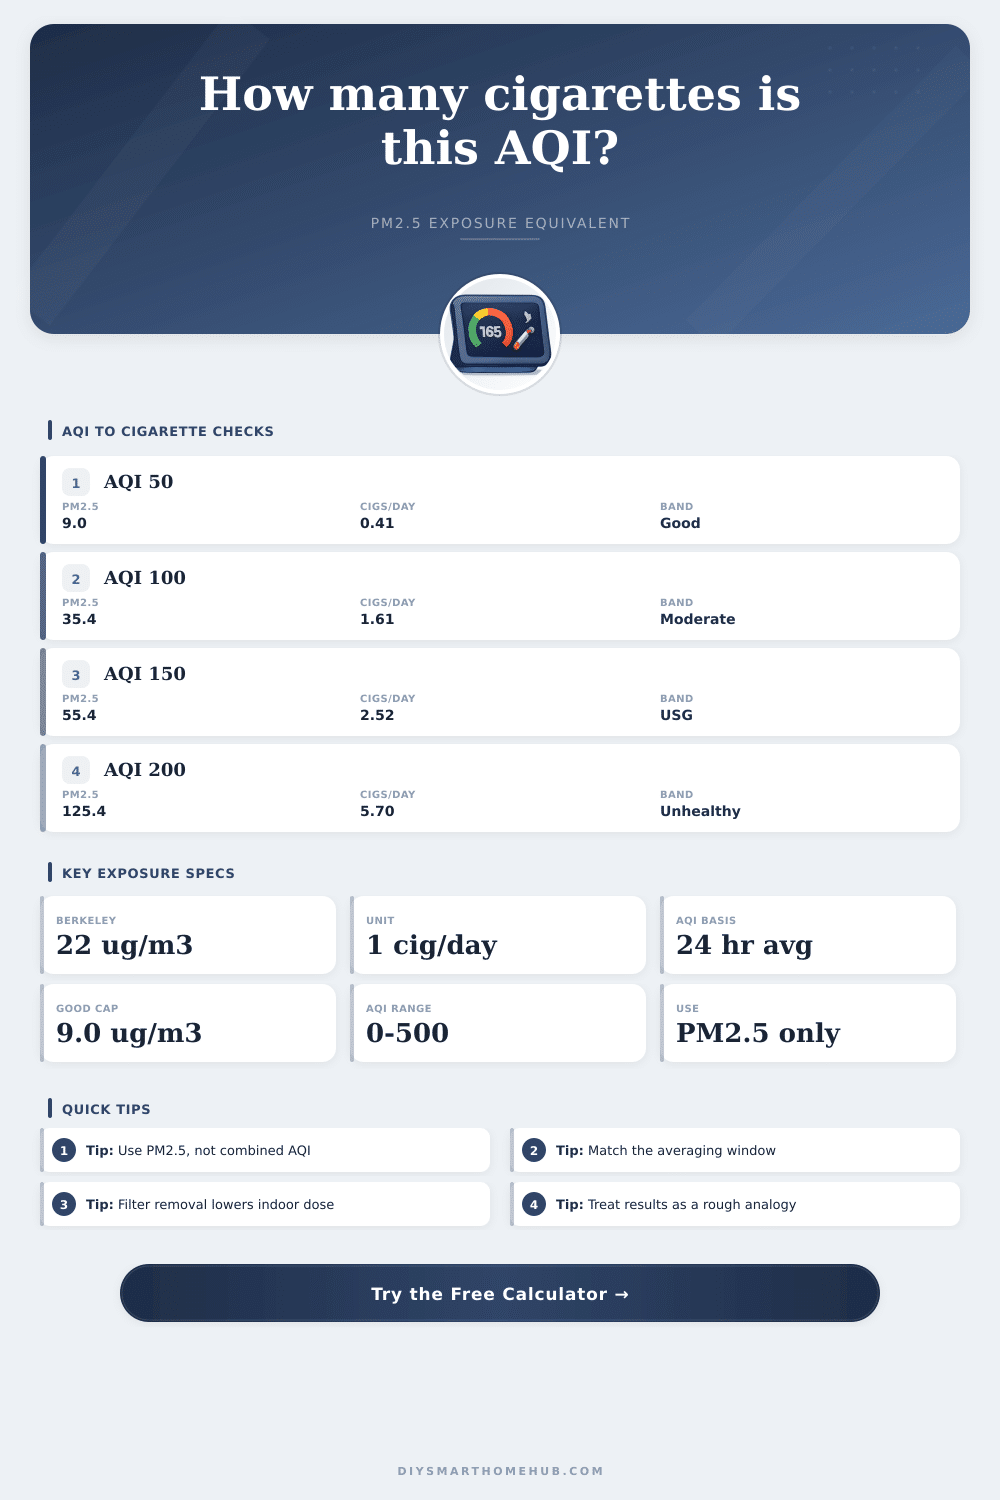
| US AQI category | AQI range | PM2.5 breakpoint | Cigarettes/day at 24 hours | Calculator role |
|---|---|---|---|---|
| Good | 0 to 50 | 0.0 to 9.0 µg/m³ | 0.00 to 0.41 | Clean baseline and target band |
| Moderate | 51 to 100 | 9.1 to 35.4 µg/m³ | 0.41 to 1.61 | Common city or mild smoke-day range |
| Unhealthy for sensitive groups | 101 to 150 | 35.5 to 55.4 µg/m³ | 1.61 to 2.52 | Sensitive-space alert range |
| Unhealthy | 151 to 200 | 55.5 to 125.4 µg/m³ | 2.52 to 5.70 | Wildfire and exposure-management range |
| Very unhealthy | 201 to 300 | 125.5 to 225.4 µg/m³ | 5.70 to 10.25 | Short-duration exposure becomes meaningful |
| Hazardous | 301 to 500 | 225.5 to 325.4 µg/m³ | 10.25 to 14.79 | High-priority smoke protection range |
| PM2.5 scenario | PM2.5 concentration | 24-hour equivalent | 8-hour equivalent | Important caveat |
|---|---|---|---|---|
| Clean indoor target | 5 µg/m³ | 0.23 cigarettes | 0.08 cigarettes | Below the current EPA annual standard |
| Top of Good AQI | 9 µg/m³ | 0.41 cigarettes | 0.14 cigarettes | Still not zero exposure |
| Berkeley reference point | 22 µg/m³ | 1.00 cigarette | 0.33 cigarettes | Rule of thumb, not an acute toxicity match |
| Top of Moderate AQI | 35.4 µg/m³ | 1.61 cigarettes | 0.54 cigarettes | Based on 24-hour PM2.5 reporting |
| Wildfire smoke day | 125 µg/m³ | 5.68 cigarettes | 1.89 cigarettes | Composition varies by fire and location |
📟Sensor / Spec Comparison Grid
| Sensor / spec profile | PM2.5 uncertainty used | Averaging strength | Best use | Exposure caution |
|---|---|---|---|---|
| Reference-grade monitor | +/-5% | Strong | Outdoor benchmark or calibrated local station | Still confirm pollutant is PM2.5 |
| Outdoor low-cost PM sensor | +/-15% | Good with correction | Porch, yard, and neighborhood smoke tracking | Humidity can bias optical readings high |
| Indoor smart-home PM puck | +/-20% | Good for trends | Bedroom, nursery, living room, and filter tests | Placement near vents or cooking changes results |
| Air purifier built-in sensor | +/-25% | Local only | Filter response and room cleanup timing | May read intake air rather than breathing zone |
| Portable personal monitor | +/-30% | Variable | Commutes and workplace comparison checks | Motion and clothing can affect flow path |
| Uncalibrated optical sensor | +/-40% | Weak | Rough spike detection only | Use the high-side range for decisions |
📌Location, Filtration, And Preset Reference
| Exposure profile | Factor used | What it means | Good input source | When to override |
|---|---|---|---|---|
| Outdoor or leaky space | 1.00x | Breathing-zone PM2.5 is close to the entered value | Outdoor PM2.5 sensor or AirNow PM2.5 AQI | Use for direct outdoor activity |
| Indoor windows open | 0.75x | Outdoor particles enter quickly with some settling | Window-adjacent indoor monitor | Increase if doors stay open |
| Indoor closed house | 0.45x | Envelope and deposition reduce exposure | Central room monitor | Lower if the measured indoor value is known |
| Filtered room | 0.25x | Sealed room or purifier already reduces PM2.5 | Room PM monitor after filter stabilizes | Use direct PM2.5 mode for measured room values |
| Vehicle cabin | 0.55x | Recirculation and cabin filtration partially reduce particles | Portable commute monitor | Adjust for open windows or poor cabin filter |
| Dusty garage/workshop | 1.20x | Local source adds exposure above the reported AQI | Garage PM puck near breathing zone | Use direct PM2.5 mode for tool-generated dust |
| Preset | Input basis | Exposure window | Location and control | Why it is useful |
|---|---|---|---|---|
| Good Outdoor Day | AQI 42 | 24 hr for 1 day | Outdoor, no extra filtration | Shows that clean-looking air is not zero PM2.5 |
| Urban Moderate Day | AQI 88 | 24 hr for 1 day | Outdoor, no extra filtration | Common city comparison against the Berkeley rule |
| Wildfire Indoor Shelter | AQI 185 | 24 hr for 3 days | Closed house plus HEPA | Separates outdoor AQI from indoor dose |
| Cooking PM Spike | PM2.5 85 | 1.5 hr for 1 day | Indoor windows open, no extra filtration | Short spikes are prorated instead of treated as all-day air |
| Smoke Season Month | AQI 155 | 18 hr for 30 days | Closed house plus HEPA | Converts repeated partial-day smoke into a period total |
💡AQI To Cigarettes Tips
Air quality app use a single number to describe the air quality. Yet, a single number does not effectively explain how breathing that air will impact you’re body over a long period of time. The idea of cigarette-equivalent fine particles are a method of converting the average daily value of fine particles into a number that people can understands.
It isnt a comparison of the chemistry of the two substance. Instead, it is a way of allowing people to make decision regarding the air quality in their area. Particles that is smaller than 2.5 micrometers can enter the lungs deep into the respiratory system.
How Fine Particles Can Be Like Smoking a Cigarette
These fine particles can lead to various health issue, including heart disease and lung problems over time. The risk of these health issues from breathing in fine particles is similar to smoke cigarettes, and both pose similar health risks due to the same method of accumulation of those risks. Twenty-two micrograms of fine particles per cubic meter of air for a full day have a similar effect on the human body to smoking a single cigarette.
This does not mean the chemistry of the two substances are similar, but that it can be used as a comparison tool to allow people to make decisions about its environment. The calculator can perform the math for you once you enter your input, but you are responsible for making sure that your inputs is correct. The air quality number on your phone may be the combined AQI or it may be the PM2.5 value.
If it is the combined AQI, you will have to manually enter that value into the app. The combined AQI may only show the ozone or nitrogen dioxide level, neither of which can be compared to cigarette. You will have to manually enter the PM2.5 value or the AQI reading.
In addition to the concentration of fine particles in the air, the duration of your exposure to that air is just as importantly as the concentration. Breathing in fine particles for a short period of time have a lesser impact on your body than breathing in those fine particles for a longer period, such as over the course of twenty-four hour. Both the exposure-hours and the days field allow you to calculate how fine particles affect your body over longer periods of time.
The location where you are breathing the air can impact the amount of fine particles that enter your body. The outdoor air may have an AQI of one hundred, but fine particles enter your home through the open window at three-quarters of the outdoor rate. If your home has closed windows, there will be even less fine particles entering your body.
If you are in a well-sealed room with proper filtration system, fine particles entering your body can be reduced by three-quarters of one percent or more. The activity level that you perform can have an impact on the amount of fine particles that enter your body. If you are performing more physical activity, your breathing rate will increase.
The higher that your breathing rate is, the more fine particles enters your body each minute. The quality of the air sensors can impact the number that the calculator provides to you. If you are using a reference-grade sensor, the amount of fine particles will be within five percent of the true value.
An uncalibrated optical sensor, however, can be forty percent to high or forty percent too low in measurement of the amount of fine particles in the air. The calculator will show an uncertainty band around the value for cigarettes to allow you to understand how much the value for fine particles may change. In the case of a borderline measurement for fine particles, you should use extra caution with the recommendation from the app.
The number that is provided to you as the cigarette-equivalent is not a limit for the amount of fine particles that you should be exposed to. Instead, it is a planning tool to allow you to decide how much of the air pollutant your body will be exposed to over time. If the total number of cigarettes over a certain period of time reaches three cigarette, it does not mean that you smoked three cigarettes.
It does, however, mean that your body is exposed to the same amount of fine particles as smoking three cigarettes over that same time period. Within the results of the calculator, there is a line that displays the target for clean air at nine micrograms of fine particles per cubic meter of air. This level have yet to be reached.
You may have to purchase additional air purification systems for your area for the levels of fine particles in that location to reach this target. Air quality can change from place to place. An outdoor location may have an AQI of one hundred in your area, but the indoor air quality within your home may be three-quarters of that concentration of fine particle.
Air quality changes from day to day, so the twenty-four hour average that is displayed for your area on various air quality apps is an average that smooths the air quality over time. The calculator will work with that average value that you enter into the application. However, you are responsible for determining whether that average value represent the length of time that you are exposed to that level of air quality.
The same logic applies to determining air quality from season to season. For example, breathing in fine particles for a few days in a given month may accumulate to the same total as breathing in fine particles for one day in another month. The annualized pace line that is visible in the results of the calculator allow you to determine what your exposure to fine particles over time would be if the current air quality in your area continued over the course of a year.
Once you have exposure to fine particles in your environment, the comparison of that exposure to cigarette-equivalent fine particles can allow you to make decisions regarding that air quality. The calculator does not make any recommendation for improving the air quality in your area. However, it does allow you to compare the air quality within your area to that of smoking cigarettes.
If the total amount of fine particles inhaled over a certain period of time is below that of smoking one cigarette, it means that the air quality in the area is less harmful than smoking a single cigarette every day. If the amount of fine particles inhaled every day is higher than smoking one cigarette each day, then you may want to limit your time outdoors in that area or purchase additional indoor air purifier for your home. The rough comparison of air quality to cigarette-smoking allow individuals to make decisions about their environment.
Even if you live in an area with high air quality, you may want to take steps to ensure that the air within your home is the best that you can provide for your body. For example, if the number of fine particles in your area is nine micrograms per cubic meter of air, you may want to purchase additional air filtration systems to ensure that the air quality within your home reach nine micrograms or less of fine particles per cubic meter of air. Air quality can change over the course of time due to various reason, such as traffic, cooking, or weather fronts.
The twenty-four hour average that is represented in the air quality apps will smooth the air quality readings over time. The air quality calculator will work with the average that you enter into the application, but you must decide for yourself whether that average of air quality reflect the amount of time that you are exposed to that level of air quality. The same logic applies to comparing air quality from season to season.
For example, breathing in fine particles for a few days within one specific month can expose your body to the same amount of fine particles as breathing in fine particles for one day within another specific month. The annualized pace line that the application represents can inform you of the total amount of fine particles that you may inhale over the course of a year if you maintain the level of air quality that you breathe in your area each day. This information can help you to decide whether to move into a different area or to purchase whole house air filtration systems for your property.
Having a way of comparing exposure to air quality to cigarettes allow you to make decisions about the air quality in your area. The calculator will not replace medical advice for air quality or health recommendations, but it will allow you to have a way of comparing the two variables. If the total amount of fine particles that you inhale each day is below the amount of fine particles that is represented by smoking one cigarette each day, then your exposure to fine particles is less harmful to your body than smoking one cigarette every day.
If you inhale a higher amount of fine particles than smoking one cigarette per day, then you may want to limit your time outdoors in your area or purchase air filtration systems indoors to control the amount of fine particles that enter your body. This rough comparison may not be exact in measuring the harm that fine particles can do to your body, but it does provide you with a number that you can use to take action within the next smoke season of the year.