Condensation Risk Calculator
Check whether a window, wall, slab, duct, pipe, or enclosure surface is close to indoor dew point. The calculator combines room RH, air temperature, measured surface temperature, scenario-specific surface behavior, sensor accuracy, airflow, and exposure duration.
🎯Condensation Risk Presets
⚙Condensation Inputs
📊Live Moisture Snapshot
📟Sensor/Spec Comparison Grid
📘Condensation Reference Tables
| Surface margin | Raw condition | Practical action band | Typical surface | Automation use |
|---|---|---|---|---|
| At or below 0 F / 0 C | Condensing | High | Glass, pipe, metal duct | Immediate wet-surface alert |
| 0 to 3 F / 0 to 1.7 C | Very close | High or watch | Mirror, window edge | Alert if sensor accuracy is modest |
| 3 to 5 F / 1.7 to 2.8 C | Narrow gap | Watch | Slab, concrete wall | Trend during cold or humid hours |
| 5 to 10 F / 2.8 to 5.6 C | Guarded | Usually stable | Exterior drywall corner | Use duration-based warnings |
| Above 10 F / above 5.6 C | Low risk | Comfortable gap | Warm interior surfaces | No condensation alert needed |
| Scenario | Surface behavior | Built-in allowance | Why the allowance changes | Common watch point |
|---|---|---|---|---|
| Single-pane glass edge | Fast cooling, nonporous | 1.5 F / 0.8 C | Visible fog forms quickly at dew point | Bottom edge and frame corners |
| Double-pane glass center | Slower cooling, nonporous | 1.0 F / 0.6 C | Center glass often stays warmer | Glass center versus edge spread |
| Low-E frame edge | Thermal bridge | 2.0 F / 1.1 C | Frame edges can be colder than glass | Aluminum spacer or sash line |
| Basement concrete wall | Cold mass, porous | 3.0 F / 1.7 C | Moisture risk depends on long exposure | Lower wall near slab |
| Exterior drywall corner | Slow surface, porous | 3.5 F / 1.9 C | Sensor drift can hide cold pockets | Closets and outside corners |
| Metal duct or pipe | Fast conductive surface | 2.5 F / 1.4 C | Small air-state swings show as water fast | Supply duct, cold water line |
| Sensor/spec profile | RH accuracy | Temp accuracy | Response | Best condensation use |
|---|---|---|---|---|
| Basic smart sensor | +/-3% RH | +/-0.5 C | Medium | Room trend away from vents |
| Calibrated room sensor | +/-2% RH | +/-0.3 C | Medium | Bedrooms, living rooms, basements |
| Remote surface probe | +/-1.5% RH | +/-0.2 C | Fast | Glass edge, slab, pipe, duct skin |
| Battery corner puck | +/-4% RH | +/-0.7 C | Slow | Closets, cabinets, crawlspaces |
| Duct-rated probe | +/-2.5% RH | +/-0.4 C | Medium | Plenum, attic duct, supply register |
| Industrial transmitter | +/-1% RH | +/-0.15 C | Fast | Critical enclosure or storage monitoring |
| Preset scenario | Indoor condition | Surface condition | Expected risk | Best comparison |
|---|---|---|---|---|
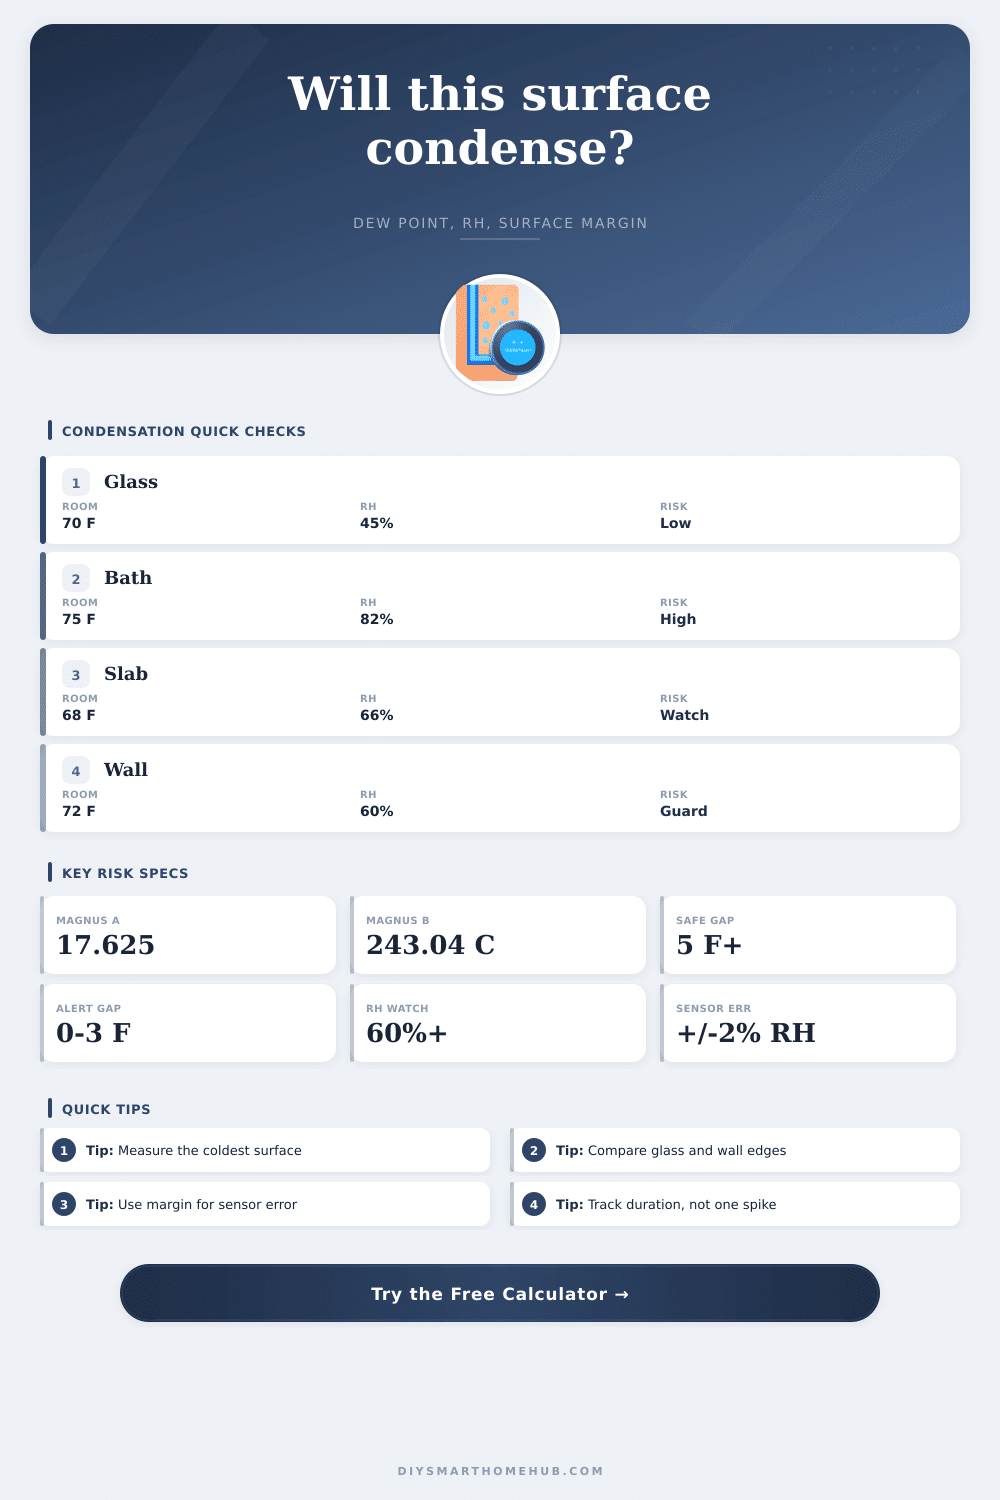
| Winter single pane | 70 F / 45% RH | 42 F glass edge | Watch to alert | Glass edge versus dew point |
| Bath mirror spike | 75 F / 82% RH | 68 F mirror | High | Steam spike duration |
| Basement wall watch | 68 F / 66% RH | 58 F wall | Watch | Long duration on porous surface |
| Attic supply duct | 94 F / 58% RH | 61 F duct | High | Duct skin versus attic dew point |
| Server cabinet door | 82 F / 42% RH | 76 F enclosure | Low | Alert temperature margin |
💡Condensation Calculation Tips
Condensation occurs when moisture in the air condense into a liquid on a surface. Condensation can occur on window frames, on cold water lines, or on basement walls. Condensation leads to slow damage to the structure of the building.
In order to avoid the cost associated with mold remediation, it is important to understand the difference between condensation caused by a momentary spike in the moisture in the air versus the continuous presence of moisture in the air. The calculator compare the temperature of a surface to the dew point of the indoor air. The dew point is a value that is calculate from the indoor air temperature and relative humidity of the indoor air.
How to Find and Stop Condensation on Building Surfaces
The comparison between the temperature of the surface and the dew point is the most importently part of the calculation. The calculator accounts for the limit of the sensors that measure the temperature of the surface and the fact that some surfaces exhibit different behaviors then other surfaces. While the indoor air temperature and relative humidity of the indoor air are use to calculate the dew point, these two values are not sufficient to provide a complete understanding of the risk of condensation on a structure.
For instance, an bedroom may have both an indoor air temperature and relative humidity that are comfortable for human beings, yet one of the edges of a window in that bedroom may be much colder than the dew point of the indoor air. The calculator allow for the entry of the actual temperature of the surface to be measured, and displays the difference between that entered value and the dew point of the indoor air. The difference between the temperature of a surface and the dew point of the indoor air is referred to as the margin.
This margin is one of the factor that must be considered in deciding whether condensation will occur on a particular structure within a building. Another factor to consider is the accuracy of the sensors. These sensors are not always accurate in the measurements of the relative humidity of the indoor air.
For instance, a smart sensor may display a relative humidity in the indoor air that is three percent of the actual relative humidity of the indoor air. Such an error could transform a low risk of condensation to a high risk of condensation. The calculator allow for different sensor profiles to be entered to provide for the inaccuracies of these sensors.
Additionally, air that remains stagnant within a building will have a lower risk of condensation on its surfaces than air that is in constant motion within the building. The calculator accounts for this by providing for allowances within the calculation to account for stationary air within a building. Another of the main factors that will determine whether condensation leads to slow damage to the structure is the duration factor.
Condensation form on the mirrors of bathrooms after hot showers, yet condensation on bathroom mirrors does not lead to slow damage to the mirror. Condensation, however, on the walls of a basement can lead to slow damage to the basement walls over time. Thus, the calculator accounts for the time factor that can transform a low risk of condensation to a high risk of condensation due to the potential of the condensation to lead to slow damage.
Some building element react differently to changes in temperature than do others. Metal ducts in a building will experience changes in air temperature more quickly than will other building elements. Thus, condensation can form on metal ducts in a building more quickly.
Concrete slabs and basement walls will not change temperatures as quickly as other elements of a building, so condensation will not form on these elements as quickly. The calculator accounts for these differences in the reaction of different building elements to condensation to allow for more accuracy in the measurement of the risk of condensation within a building. The calculator display the maximum relative humidity of the indoor air that a structure can have before condensation begins to occur on that structure.
This value is one way of determining how to control the humidity of the indoor air. For instance, if a structure can only have a relative humidity of 55% before condensation occurs, then the air in the indoor space can be considered risky at 60% relative humidity. Reference tables within the calculator display what action should be taken based off the margin between the surface temperature and the dew point.
Small margins, of one or two degrees for instance, lead to different actions than margins of five or six degrees between the surface temperature and the dew point. The calculator calculates a risk score to display the risk of condensation within a building. Many individuals believes that the risk of condensation is highest on the coldest days of the year.
The highest risk of condensation, however, occurs during the shoulder seasons of a year. During the shoulder seasons of a year, the outdoor temperatures are moderately cold, yet the indoor air humidity may be high. During the spring, for instance, it may rain frequently.
Condensation can occur during these periods of rainfall more than on the coldest day of winter when heating systems keep the indoor surfaces warmer. Condensation risk can be test by using the calculator to test the impact that different conditions of indoor air have upon condensation on a surface. The dew point is a calculated value, rather than a directly-measured value of indoor air.
The Magnus equation is use to calculate the dew point of indoor air from its temperature and relative humidity. The surface margin between the surface temperature and the dew point is the difference between those two values. Allowances are made within the calculator to the value of the surface margin to account for the limits of the sensors that measure those temperatures, the behavior of the material of the structure, and the length of time that exposure to condensation occur.
Finally, the most important benefit of using this calculator is that it enable an individual to recognize the condensation patterns within a building over time. With the calculator, condensation on structures will eventually become noticeable and an individual will begin to recognize which structures have condensation patterns to them. Thus, recognizing these patterns will allow an individual to focus their attention on those structures.