Wind Turbine Efficiency Calculator
Compare available wind power, measured electrical output, rotor Cp, Betz-limit usage, and daily energy yield for small wind turbines and smart-home battery systems.
⚙Real efficiency presets
📏Turbine and wind inputs
🧮Current efficiency spec grid
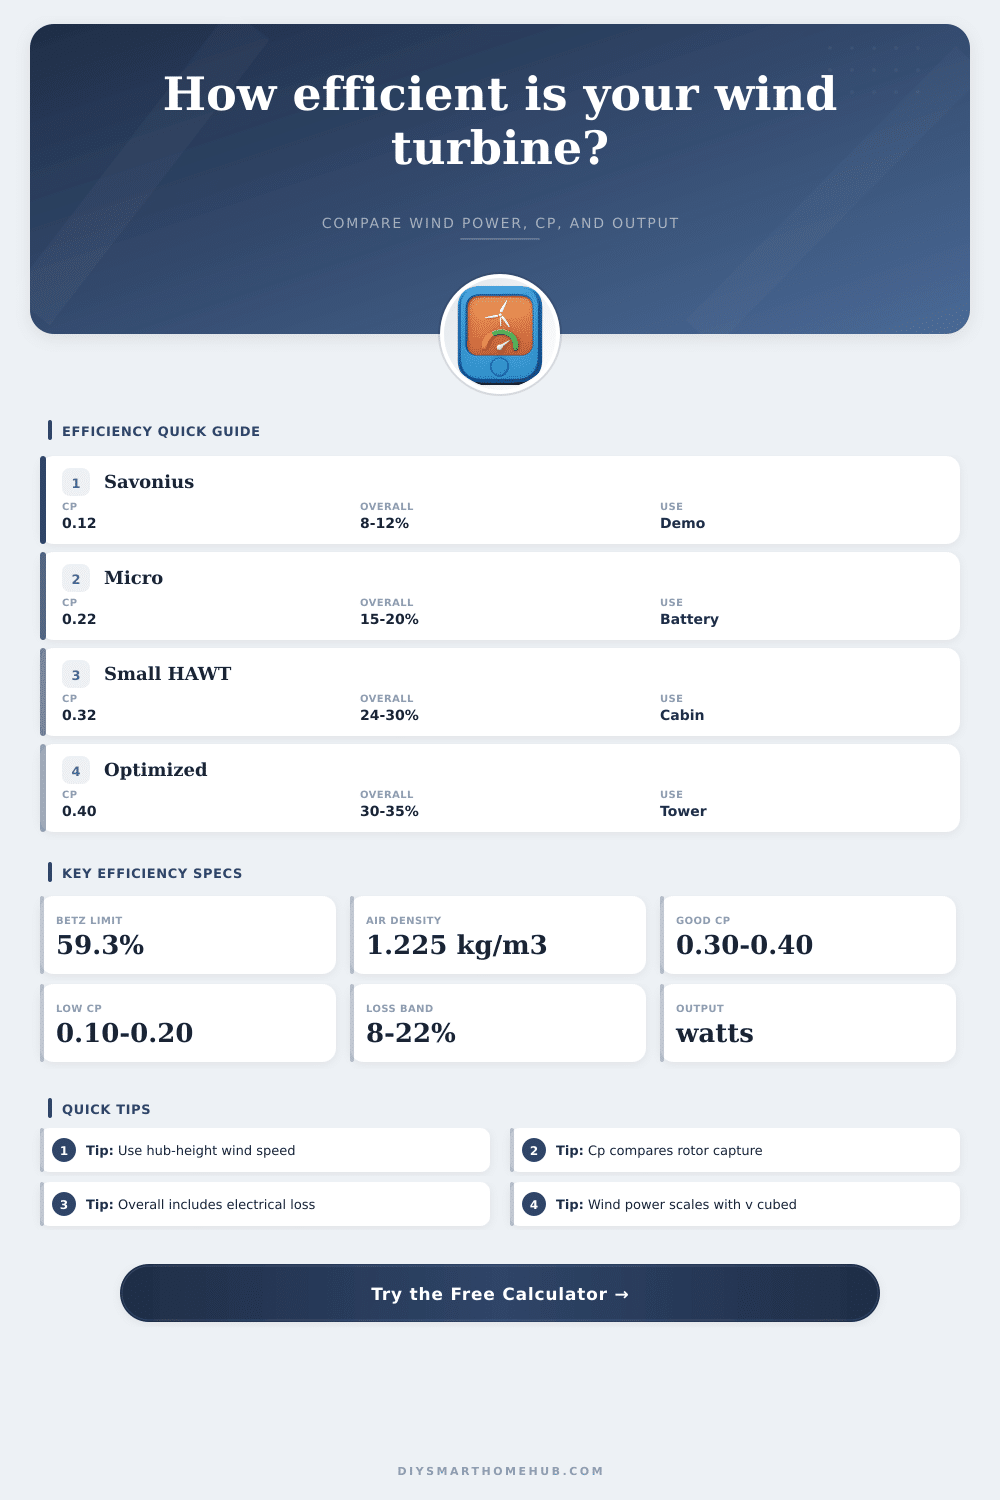
📊Efficiency bands by rotor type
| Rotor type | Typical Cp band | Overall electrical band | Performance reading |
|---|---|---|---|
| Savonius or drag VAWT | 0.10 to 0.18 | 7% to 14% | Low Cp is expected because drag rotors trade efficiency for simple starting behavior. |
| Lift vertical-axis rotor | 0.20 to 0.32 | 15% to 25% | Good when mounted in clean wind with low bearing and generator losses. |
| Micro horizontal-axis turbine | 0.18 to 0.28 | 14% to 22% | Small blades, simple alternators, and charge controllers often limit efficiency. |
| Small horizontal-axis turbine | 0.25 to 0.38 | 20% to 31% | A realistic target for well-matched rotors on open towers. |
| Optimized tower turbine | 0.35 to 0.45 | 28% to 37% | Strong results, but still below the 0.593 Betz theoretical ceiling. |
🌬Wind power sensitivity
| Wind speed at rotor | Power density | At 25% overall | Calculator meaning |
|---|---|---|---|
| 4 m/s / 8.9 mph | 39 W/m² | 10 W/m² | Small errors in wind measurement can dominate the efficiency result. |
| 5 m/s / 11.2 mph | 77 W/m² | 19 W/m² | A common lower planning baseline for small wind checks. |
| 6 m/s / 13.4 mph | 132 W/m² | 33 W/m² | Efficient small rotors begin showing useful continuous output. |
| 7 m/s / 15.7 mph | 210 W/m² | 53 W/m² | Output rises sharply, so controller limits and furling matter more. |
| 9 m/s / 20.1 mph | 447 W/m² | 112 W/m² | Check whether the logged watts are already limited by the charge system. |
🔋Common small-wind logging scenarios
| Scenario | Inputs to watch | Primary result | Secondary check |
|---|---|---|---|
| Battery maintainer turbine | Small rotor, low average watts | Overall efficiency verifies useful charge capture. | Availability shows whether output persists through the day. |
| Smart shed wind-solar hybrid | Hub wind, rotor diameter, DC watts | Cp confirms the rotor is loaded near its useful band. | Daily kWh estimates the wind share of the load. |
| Cabin tower data review | Open exposure and controller output | Betz usage catches unrealistic or mis-scaled readings. | Specific output compares watts per swept area. |
| Roof turbulence audit | Measured roof wind and AC watts | Low Cp can reveal turbulent or obstructed flow. | Compare several wind-speed bins, not one instant. |
🌡Air density reference
| Condition | Density used | Power vs standard | When to select it |
|---|---|---|---|
| Cold dense sea-level air | 1.292 kg/m³ | 105% | Cold coastal sites or winter logs with dense air. |
| Standard sea-level air | 1.225 kg/m³ | 100% | Baseline turbine comparisons and default planning. |
| Warm lowland air | 1.184 kg/m³ | 97% | Warm weather testing close to sea level. |
| Highland site | 1.112 kg/m³ | 91% | Sites around 1000 m elevation where air is thinner. |
| Mountain site | 1.007 kg/m³ | 82% | High-elevation systems where output per swept area drops. |
✅Efficiency calculation tips
Wind power is a process of using the wind to produce electricity. Efficiency with a wind power system can be determine by calculating the energy from the wind that reaches the electrical wires. To understand the efficiency of the system, a person must be able to understand the difference between the energy in the wind and the energy that a person can use.
Whether one is choosing a wind turbine, logging the data from a turbine, or troubleshooting the machine, the numbers associated with the performance of the rotor are importance in determining whether or not the rotor is working correct or losing energy to other factors of the system. The energy that is contain within the wind is directly related to the speed of the wind. A location that features a higher speed of wind will contain more energy than a site that features a lower wind speed.
How to Calculate Wind Turbine Power and Efficiency
A calculator can handle the mathematics behind the calculation of the available energy in the wind at a location by entering the rotor’s diameter and the wind speed at the hub height of the rotor. By entering these variables, a person can remove the guesswork regarding the area of the rotor that is expose to the wind and the energy that that area can produce. Additionally, a person must also determine how much of the available energy the rotor is capture from the available energy.
The shape of the rotor will impact the efficiency of the system. For example, Savonius rotors tend to start with light winds but rarely go past a coefficient of performance of 0.18. In contrast, lift-based horizontal rotors can reach a coefficient of performance between 0.25 and 0.40.
The theoretical maximum for the coefficient of performance is the Betz limit. The Betz limit is 59.3 percent for all rotors. No rotors will reach the Betz limit.
The coefficient of performance as measured by the calculator will indicate where the rotor is positioned within the expected coefficients of performance for that type of rotor design. Additionally, there will also be electrical losses between the rotor and the battery or the grid. There will be loss in the efficiency of the system due to heat from the generator, the resistance of the rectifier, the electrical efficiency of the controller, and the loss in the resistance of the wiring.
These losses can range from 10 to 25 percent of the available mechanical power of the rotor. By entering the percentage of loss of the system, the calculator can subtract this value to determine the mechanical power of the rotor. This value can then be compare with the efficiency of the entire system, which includes all conversion steps from the rotor to the output to the battery or grid.
The air density will change with the temperature and the elevation of the installation of the wind turbine. Cooler air contains more mass per unit of volume than warm air. Additionally, air at sea level is denser than at higher elevations.
These differences in air density can create a difference in power output of as much as 15 or 20 percent. By selecting the air density in the calculator, a person can enter these variables to calculate the available energy. The selected value for air density will ensure that any comparison between the available energy and the produced energy is accurate.
The energy that the system can produce each day will depend on how much of the time the available energy at the site reaches the turbine’s measured output. A turbine can produce 300 watts of power at a given speed of wind. However, if the wind is too low, the turbine will produce zero watt.
Additionally, if the controller for the system is set to limit the output of the machine to protect the battery, the system will again produce zero watts. The availability of wind input to the machine can be entered in the calculator to determine the daily energy in kilowatt-hours that the system will produce. This daily estimate in kilowatt-hours is the value that most system owner will use to determine the size of the battery that must be used to power the loads in the system.
The location of the anemometer that measures the wind can have a significant impact on the efficiency of the calculations that are performed. Anemometers that are located on the roof of a building may record lower speeds of the wind than anemometers that are located on the towers of the turbine installation. Additionally, the anemometer that is located at the turbine may record gusts of wind that are not reflected in the average wind speed that is use to calculate the efficiency of the system.
The calculator assumes that the recorded wind values and the output of the system refer to the same time period. If the recorded data does not match the output data of the system, the coefficient of performance will be inaccurate and any attempts at troubleshooting the system will be difficult. The variables that affect the performance of the system that cannot be accounted for in the calculator may also impact the efficiency of the system.
For instance, the stiffness of the tower, the friction in the bearings of the turbine, the cleanliness of the blades, and the settings of the controller for the system all have the potential to alter the energy output that can be provided to the loads of the system. The rotor may exhibit good performance at high speeds of the wind but may lose that same performance when the wind change direction or when the blades fill with ice. These factors may not be accounted for in the calculator but have an impact on the performance of the system.
The reference tables for the calculator will show the typical coefficients of performance of each of the different types of rotors. Additionally, these tables will show the electrical efficiencies of the systems with the electrical losses of the system accounted for. If the measured coefficient of performance is within the expected coefficient of performance for that type of small horizontal-axis rotor, the system is functioning normally.
If the coefficient of performance is significantly below the typical coefficient of performance for that machine, the issues may be problems with the turbulence in the air at the site, errors in the recorded wind speed, or excessive losses in the electrical system of the machine. Using this tool over time with different conditions at the site will help a person understand the performance of the system. For instance, a person can use the tool during periods when the turbine is performing well and again when the system output drops to understand whether the issue is with the size of the turbine or the electronics.
Smaller wind systems may exhibit the same or even better performance than larger systems if placed in the proper location. For instance, a small wind turbine that is located on a tall tower and exposed to clean, strong winds can produce as much energy as a much larger system that is located in an area with turbulence in the air or with a low average wind speed. By calculating the available energy and the energy output by the system, a person can make an informed decision about the system.
Once an individual owner has made a decision, they can decide whether to accept the performance of the system or to make adjustments in how the system is exposed to the environment or the efficiency of the system’s component. A system does not need to be very large to capture enough energy to be useful. A small system located in the correct location may outperform a much larger system with poor placement.
By using the calculator to determine the energy output of a system, an individual can decide whether to make improvements to the system or to purchase a different model of rotor for the system.