WiFi Path Loss Calculator
Estimate free-space loss, wall and floor attenuation, received signal strength, link margin, and practical smart home WiFi range from one room to a whole-house layout.
Calculated Signal Path
Practical range is solved backward from the selected receiver threshold, transmit power, combined antenna gain, desired fade margin, and entered obstacle losses.
| Obstacle | Modeled Loss | Where It Applies | Calculator Use |
|---|---|---|---|
| Clear line of sight | 0 dB | Same room or open hallway | Use when only distance matters |
| Drywall or hollow wall | 3 dB each | Modern interior partition | Default for typical smart home rooms |
| Plaster or lath wall | 6 dB each | Older homes and dense interior walls | Use for heavier room separation |
| Brick or block wall | 8 dB each | Fireplace, garage, exterior partition | Use for masonry between zones |
| Concrete or masonry | 12 dB each | Basement, slab, thick wall | Use for harsh indoor attenuation |
| Foil-backed insulation | 15 dB each | Garage wall, radiant barrier, utility space | Use when reflective material is in the path |
| Metal obstruction | 25 dB each | Metal door, ductwork, appliance cluster | Use sparingly for severe blocking |
| Floor or ceiling | 10 dB each | Between stories or basement ceiling | Entered separately from wall count |
| Profile | Frequency Used | Typical Threshold | Smart Home Fit |
|---|---|---|---|
| Sub-GHz WiFi HaLow sensor | 915 MHz | -98 dBm | Longer reach sensor paths where supported hardware exists |
| 2.4 GHz IoT sensor | 2412 MHz | -92 dBm | Battery sensors, plugs, thermostats, and low-rate devices |
| 2.4 GHz phone or hub | 2437 MHz | -82 dBm | General control devices needing moderate reliability |
| 5 GHz camera stream | 5200 MHz | -67 dBm | Video devices that need a cleaner and stronger signal |
| 5 GHz WiFi 6 client | 5500 MHz | -70 dBm | Modern hubs, panels, and tablets near the access point |
| 6 GHz WiFi 6E client | 6425 MHz | -66 dBm | High-throughput rooms with minimal wall separation |
| Received Signal | Expected Behavior | Typical Smart Home Use | Planning Note |
|---|---|---|---|
| -50 to -60 dBm | Very strong | Video panels, cameras, fast local control | Usually close to the access point |
| -61 to -67 dBm | Strong | Doorbells, camera streams, voice displays | Good target for reliable video |
| -68 to -75 dBm | Usable | Phones, hubs, switches, smart displays | Stable for many control tasks |
| -76 to -85 dBm | Weak | Low-rate sensors and simple devices | Keep extra fade margin if possible |
| Below -85 dBm | Marginal | Only robust low-rate profiles | Often needs less distance or fewer obstacles |
| Scenario | Typical Distance | Wall/Floor Model | Calculator Starting Point |
|---|---|---|---|
| Single Room 12×14 | 18 ft / 5.5 m | 0 to 1 drywall wall | Use 2.4 GHz IoT or 5 GHz client |
| Open Plan 20×30 | 38 ft / 11.6 m | Clear line or 1 light wall | Good for open router placement checks |
| Apartment 800 sq ft | 55 ft / 16.8 m | 3 drywall walls | Useful for hub-to-bedroom reach |
| Garage Zone 20×20 | 65 ft / 19.8 m | Brick or insulated wall | Check opener, EVSE, and plug modules |
| Whole House 2000 sq ft | 90 ft / 27.4 m | 5 walls and 1 floor | Tests whether a single AP is realistic |
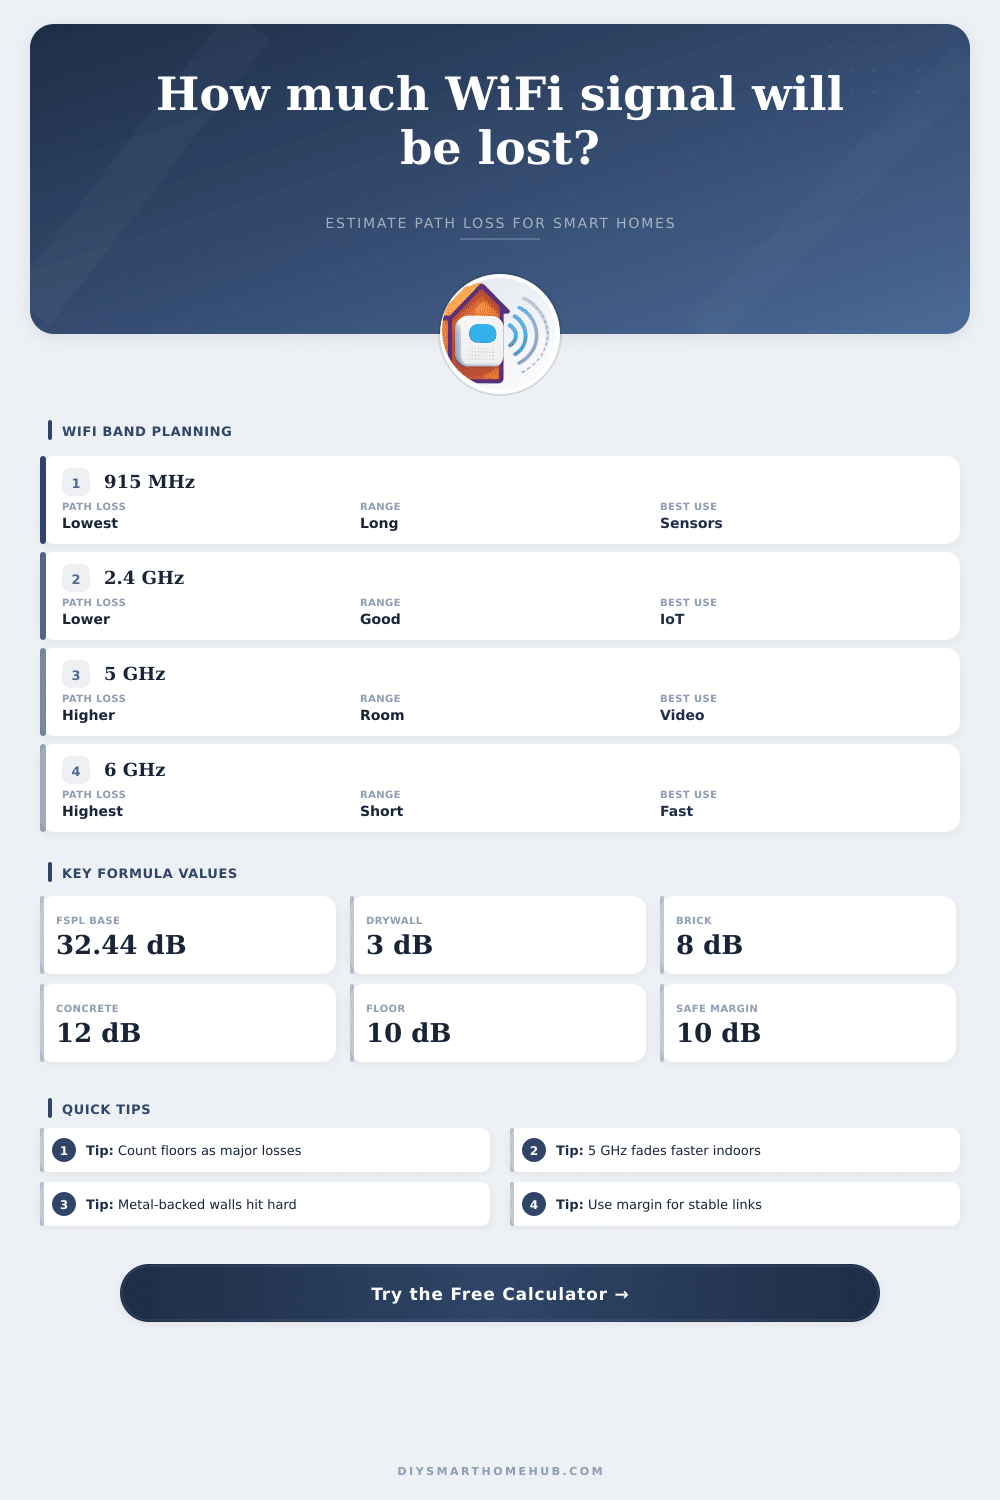
Path loss is the reduction in power between the access point and the device receiving the signal due to the fact that radio signals loses strength as they travel through space. Path loss is divided into two components: free space loss, and loss due to walls and floor. Free space loss is the concept that radio energy naturaly spreads out as the radio signal travels away from the source.
Higher frequencies experiences more rapid spreading out of the signal than lower frequencies. Thus, 5 GHz and 6 GHz signals experience more path loss than 2.4 GHz signals. Walls and floors also contribute to path loss.
How Wi-Fi Signals Lose Strength and How to Use the Path Loss Calculator
For instance, a wall or floor will contribute more to path loss than a drywall partition. These various factor are combined within the calculator to determine the total path loss between the access point and the device. This total path loss allows for the calculation of whether or not the signal strength that remains is above the threshold that the device require to receive data.
The distance and type of materials between the access point and the device are two of the most important variable to input into the path loss calculator. Distance contribute to path loss because the strength of the signal diminishes with increasing distance between the access point and the device. In addition to distance, the materials in the way of the signal contribute to path loss, as well.
Materials like metal or foil-backed insulation will attenuate the signal more than drywall, for instance. Different manufacturers creates access points that emit signals of different strengths. Additionally, access points also emit different strength signals at different frequency bands (2.4 GHz, 5 GHz, 6 GHz).
Finally, the fade margin can be adjusted to account for changes in the environment. Fade margin takes into account movement of individuals through the signal path, movement of furniture, and degradation of the antennas over time. The path loss calculator provides two different values as its output.
One is the received signal strength, which indicates how strong the signal is that reaches the receiving device. The other value is the link margin, which measures how much strength remains in the signal after transmission before the signal strength begin to drop to levels that the receiving device can no longer decode. A large link margin indicates that the signal is strong and will remain strong even in the face of small changes in the environment.
A small link margin indicates that the signal is weaker and more likely to drop or time out in response to change in the environment. The common assumption of the need to place the access point in the center of the house may seem like a good solution to ensuring even coverage of the device throughout the house. However, access points may not be able to find the best location in the center of a house due to obstacles to the signals, such as stairwells, HVAC ducts, or exterior walls blocking the signals from those locations.
For instance, an access point located in a garage may only have to travel through one wall to reach the devices in the house, but that signal may still experience path loss due to the presence of insulation with a radiant barrier. Thus, the path loss calculator may be used to determine the best location of the access point in the house by tracing the path that the signal will travel. The frequency at which the access point and device communicate with each other is another important variable.
For instance, lower frequencies, such as 2.4 GHz, can travel farther and penetrate obstacles more easy than higher frequencies. The benefit of the higher frequencies, such as 5 GHz or 6 GHz, is that they have more available bandwidth and there is less interference from other devices using that same frequency. For instance, a video doorbell might be able to successfully use 5 GHz when the door is open, but have to use 2.4 GHz when the door is closed and the signal cannot easily travel through the door.
Therefore, the path loss calculator can be used to calculate the signal loss for both the 5 GHz and 2.4 GHz frequencies to determine the best frequency for the device. Many variables exist in a real home that may impact the signal strength. For instance, different levels of humidity throughout the year will impact the attenuation of the signal of plaster and wood walls.
Additionally, the movement of metal appliance throughout the house may impact the link margin of the signal. Additionally, the presence of neighboring wireless networks may increase the noise floor of the environment, which may decrease the link margin. Because of these variables, it is best to ensure that there is a link margin of at least 10 dB rather than the minimum margin that is calculated by the signal loss equation.
In the tool, there are reference tables that can be used to adjust the signal loss based on the materials in the house. For instance, the tables indicates that a floor has a different signal loss than a wall made of drywall, and that foil-backed insulation has a different signal loss than drywall. These tables can be used to make adjustments to the signal loss calculations based on the materials used in one’s own home.
Before the access point is mounted to any location in the home, the path loss calculator can be used to determine if the location of the access point will allow for each device in the house to remain within its reception range. The calculator can help to determine if moving the access point will increase the margin for the device, or if a specific frequency should be used at a specific location. Thus, the path loss calculator helps prevent common mistakes in installing the access point hardware in a home.