Lithium Battery State of Charge Calculator
Estimate lithium battery SOC from measured pack voltage, chemistry curve, load or charge correction, rated capacity, and the reserve you want to keep unused.
⚡Real Battery Presets
🔋Battery Measurements
⚙Spec Comparison Grid
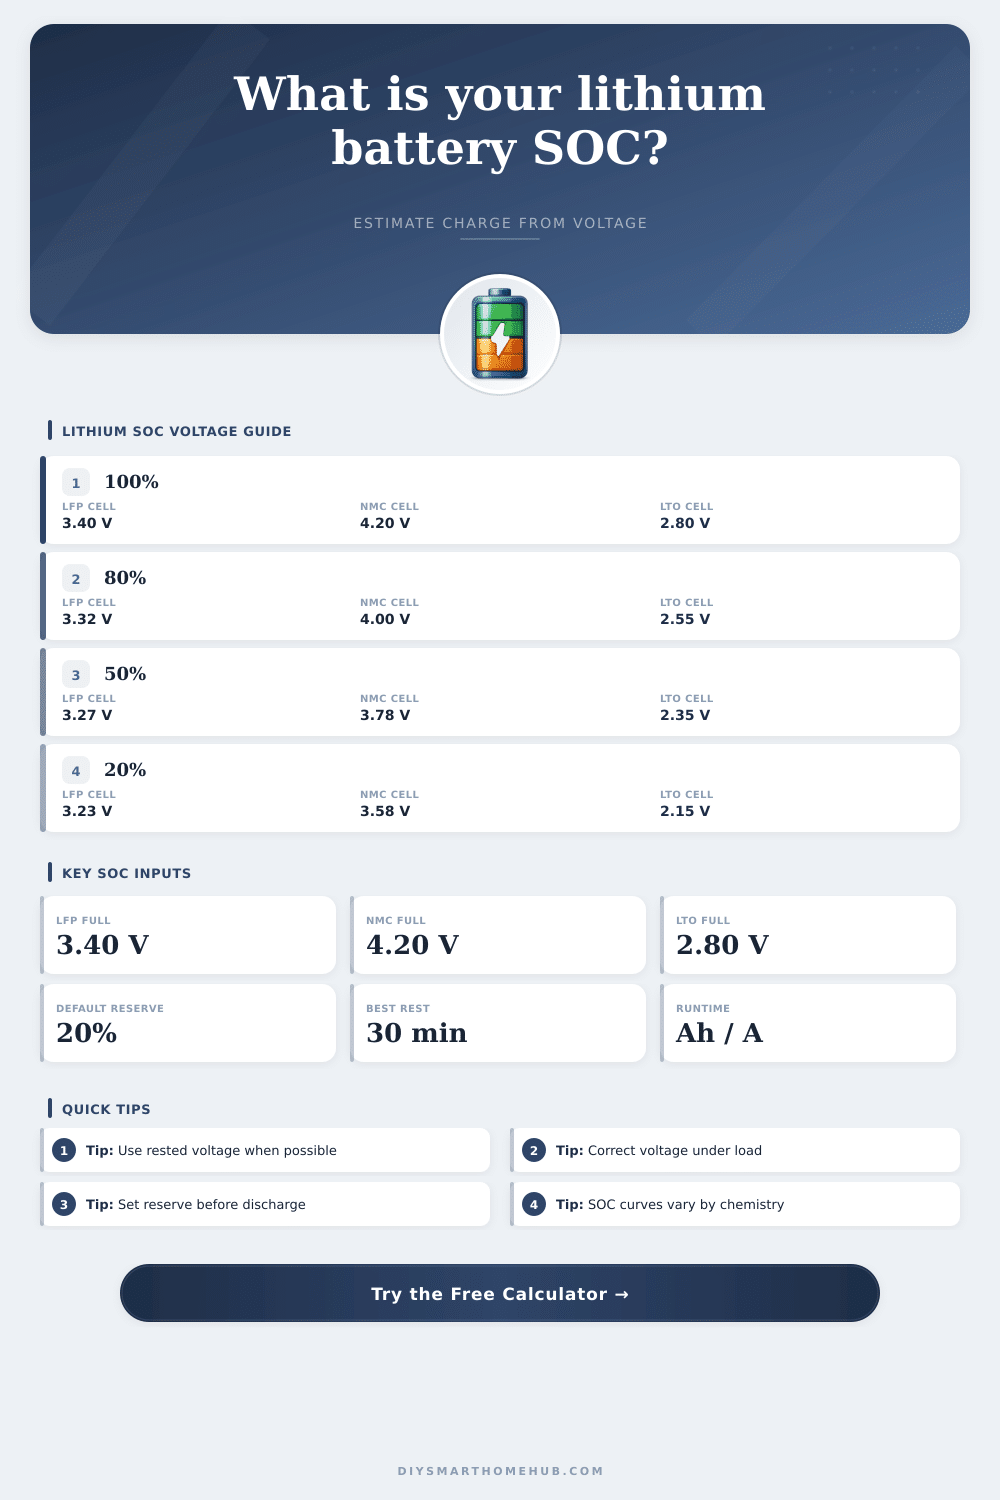
📊LiFePO4 Resting Voltage Reference
| SOC | Cell voltage | 4S 12.8V pack | 16S 51.2V pack |
|---|---|---|---|
| 100% | 3.40 V | 13.60 V | 54.40 V |
| 90% | 3.35 V | 13.40 V | 53.60 V |
| 80% | 3.32 V | 13.28 V | 53.12 V |
| 70% | 3.30 V | 13.20 V | 52.80 V |
| 60% | 3.28 V | 13.12 V | 52.48 V |
| 50% | 3.27 V | 13.08 V | 52.32 V |
| 40% | 3.26 V | 13.04 V | 52.16 V |
| 30% | 3.25 V | 13.00 V | 52.00 V |
| 20% | 3.23 V | 12.92 V | 51.68 V |
| 10% | 3.20 V | 12.80 V | 51.20 V |
| 0% | 2.90 V | 11.60 V | 46.40 V |
📈NMC, LiPo, and LTO Voltage Reference
| SOC | NMC cell | LiPo cell | LTO cell |
|---|---|---|---|
| 100% | 4.20 V | 4.20 V | 2.80 V |
| 90% | 4.10 V | 4.12 V | 2.65 V |
| 80% | 4.00 V | 4.03 V | 2.55 V |
| 70% | 3.92 V | 3.95 V | 2.47 V |
| 60% | 3.85 V | 3.87 V | 2.40 V |
| 50% | 3.78 V | 3.80 V | 2.35 V |
| 40% | 3.72 V | 3.74 V | 2.30 V |
| 30% | 3.66 V | 3.69 V | 2.25 V |
| 20% | 3.58 V | 3.62 V | 2.15 V |
| 10% | 3.45 V | 3.50 V | 2.00 V |
| 0% | 3.20 V | 3.30 V | 1.80 V |
🧪Chemistry Comparison Table
| Chemistry | Nominal cell | Typical full charge | SOC behavior |
|---|---|---|---|
| LiFePO4 / LFP | 3.2 V | 3.65 V charge, about 3.40 V rested | Very flat middle curve; small voltage changes matter. |
| NMC / NCA / 18650 | 3.6 V to 3.7 V | 4.20 V | Sloped voltage curve; voltage SOC estimate is easier. |
| LiPo | 3.7 V | 4.20 V | Similar to NMC, but load sag can be large at high C rate. |
| LTO | 2.3 V to 2.4 V | 2.70 V to 2.80 V | Wide cycle life; lower voltage per cell. |
📐Common Pack Examples
| Pack type | Series cells | Nominal voltage | Typical use |
|---|---|---|---|
| 12V LiFePO4 | 4S | 12.8 V | RV, marine, small solar storage |
| 24V LiFePO4 | 8S | 25.6 V | Solar carts, inverters, workshop backup |
| 48V LiFePO4 | 16S | 51.2 V | Server rack battery and home backup |
| 48V NMC e-bike | 13S | 46.8 V to 48.1 V | E-bike and compact mobility packs |
| 6S LiPo | 6S | 22.2 V | Drone, RC, and portable high-current loads |
💡Calculation Tips
Monitoring the voltage of a lithium battery can be difficultly. The voltage reading of a lithium battery are not always an accurate representation of the amount of energy the battery has left. From the voltage monitor of a battery, a voltage number can be displayed, but the voltage number isnt going to convey to a person whether there is a small amount of energy or a large amount of energy left in the battery.
This is due to the fact that lithium batteries does not work like fuel tank. Additionally, the voltage levels of lithium batteries dont drop visibly as the energy levels drop from the batteries. The chemical process of the batteries hides the energy levels behind a voltage curve.
Why battery voltage does not show true charge
The voltage reading of a lithium battery can be inaccurate due to a phenomenon known as voltage sag. Voltage sag will occur when a heavy inverter is running. Due to this phenomenon, the voltage from the battery will drop instant.
This may make the voltage of the battery appear as if the battery is nearly empty with its current power output. However, the voltage will bounce back to its normal reading after a person turns off the heavy inverter. Thus, rested voltage is a more accurate representation of the voltage of a battery than the voltage that is measured while the battery is under load.
To measure rested voltage, the battery should sit idle for a period of time. The rested voltage will be more accurate because the chemical components of the battery will have had time to stabilize. The chemistry of the lithium battery can change, so it is important for a person to understand the chemistry of the battery they are using.
For instance, lithium iron phosphate batteries, or LFP batteries, is stable chemistries. However, LFP batteries have a flat voltage discharge curve. A flat voltage discharge curve mean that the voltage output by an LFP battery will remain the same throughout a portion of the batterys energy output.
Thus, the voltage as measured by a multimeter will show a very small difference in voltage whether the energy level of the battery drop from 80% to 40%. Therefore, although LFP batteries will provide steady power output, it can be difficult for individuals to understand the remaining energy level of an LFP battery. Chemistries such as NMC and LiPo batteries is different than LFP batteries.
NMC and LiPo batteries have a sloping voltage discharge curve. This make it easier for individuals to understand when the voltage levels of the battery are dropping with the energy being used. However, NMC chemicals are more sensitive to discharging to 0% energy compared to LFP batteries.
If a person completely discharges an NMC battery, it can cause permanent damage to the chemistry of the battery. Due to the different chemical reaction of each battery type, it is important for individuals to understand the chemistry of the batteries that they are using to avoid damaging them. A tool can be used to estimate the charge level of a battery.
The calculation tool can calculate the theoretical rested voltage of the battery. This calculation can take into account the current load on the battery as well as the internal resistance of the battery pack to account for voltage sag. In this tool, a person can input their battery measurements.
The tool will perform the calculations for the person. Additionally, the tool will display the voltage of the battery as a percentage that individuals can use. This percentage is a more usable percentage of energy compared to raw voltage measurement.
The percentage that the battery can display indicate the state of charge. In addition to percentage, however, a battery reserve should be established. Many individuals dont wish to run their batteries down to 0% energy levels.
Running a battery to 0% will put stress on the battery. Additionally, the battery management system on the battery may shut the battery off sudden when the battery reaches 0%. For many people, using the bottom 20% of the batteries as a reserve will provide an additional layer of safety for the battery.
This percentage can also be accounted for in the calculation tool so that the person knows the usable power of the battery. Knowing the remaining runtime of a battery is more important than the remaining amp hours that a battery has. If a person knows the number of hours of runtime that a battery currently has at full load, they can decide whether or not they need to turn off an appliance such as a space heater.
Thus, knowing the runtime of the battery allows individuals to plan the energy use of the battery. However, voltage estimates are never perfect. The voltage can change due to temperature shift in the battery and the age of the battery.
As batteries age, their internal resistance increase. Higher internal resistance creates more voltage sag. However, for most applications, the voltage-corrected estimate is all that most users will need in order to ensure that there essential appliance such as lights and refrigerators continue to run.