Solar Panel Degradation Calculator
Estimate present output, year-25 capacity, lifetime energy lost, and warranty margin for a home solar array using panel type, age, heat, soiling, shade, and maintenance assumptions.
☀️Solar Array Presets
⚙️Panel Aging Inputs
Degradation Estimate
🔋Panel Technology Spec Grid
📊Typical Degradation Reference
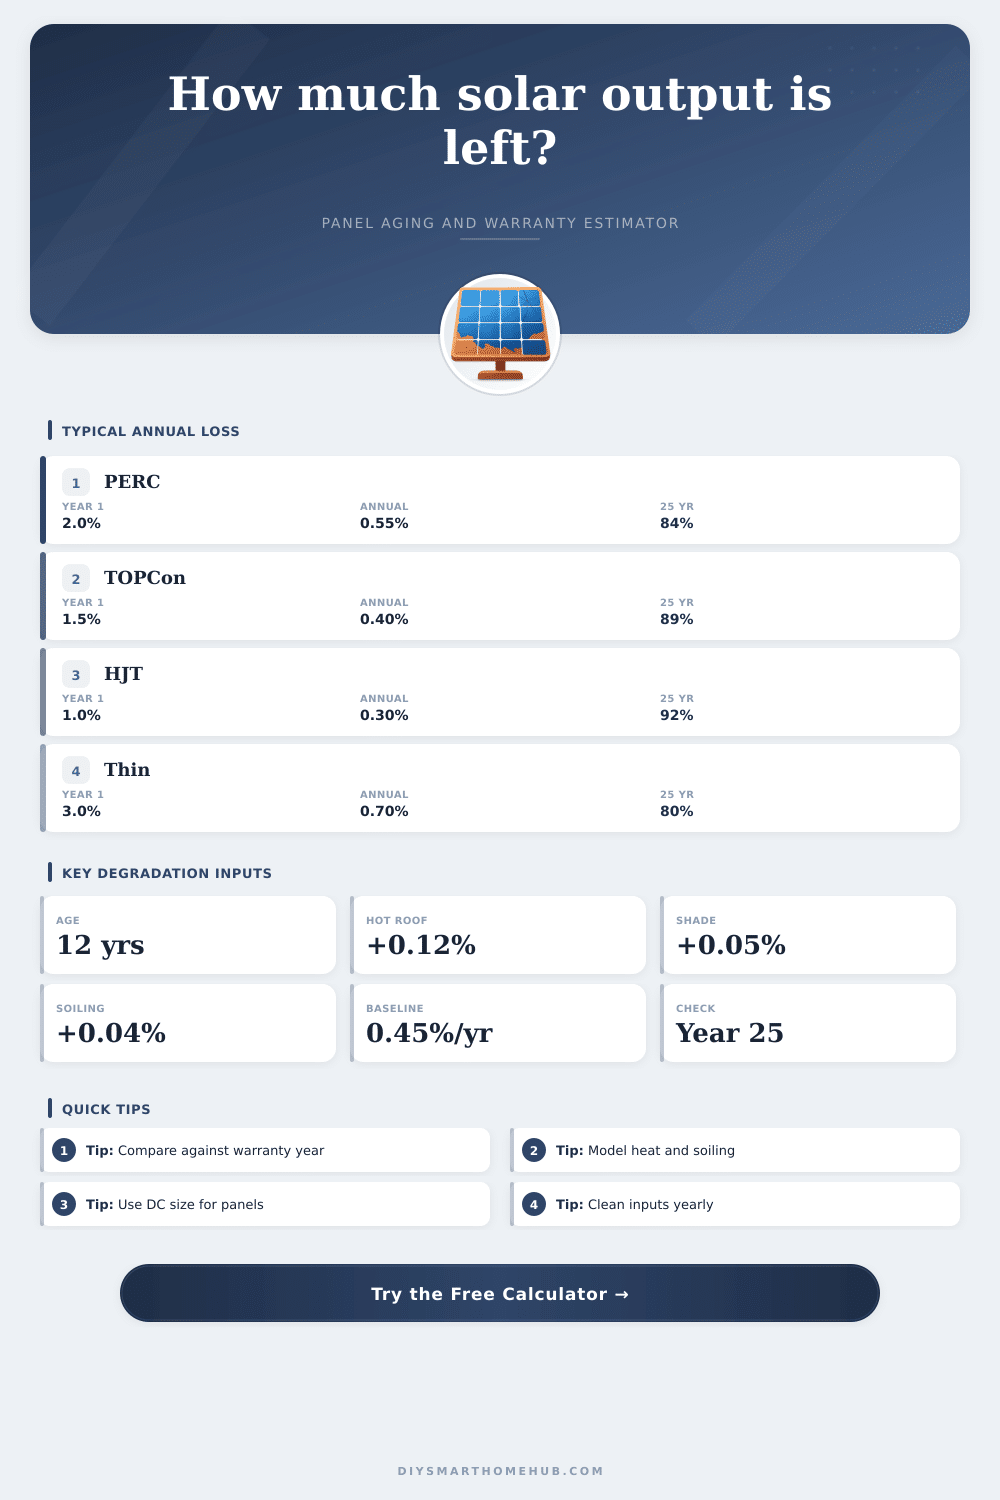
| Panel category | First-year loss | Annual loss after year 1 | Expected retained output at year 25 |
|---|---|---|---|
| N-type HJT premium module | 0.5% to 1.5% | 0.25% to 0.35% | 91% to 93% |
| IBC back-contact module | 1.0% to 1.5% | 0.25% to 0.40% | 89% to 92% |
| N-type TOPCon residential module | 1.0% to 2.0% | 0.35% to 0.45% | 88% to 90% |
| Mono PERC residential module | 1.5% to 3.0% | 0.45% to 0.60% | 82% to 86% |
| Older polycrystalline module | 2.0% to 3.5% | 0.60% to 0.80% | 78% to 83% |
| Thin-film residential accessory panel | 2.0% to 4.0% | 0.50% to 0.90% | 76% to 84% |
🌡️Climate and Mounting Adjustment Table
| Condition | Annual stress adder | Why it matters | Calculator treatment |
|---|---|---|---|
| Hot roof with limited airflow | +0.08% to +0.18% | Higher cell temperature accelerates material aging | Added to base annual degradation |
| Dusty desert or pollen-heavy site | +0.06% to +0.16% | Frequent soiling can hide underperformance | Added with soiling modifier |
| Coastal salt-air exposure | +0.04% to +0.12% | Corrosion risk rises if sealing or frames age poorly | Added as climate stress |
| Cold roof with strong airflow | -0.03% to +0.04% | Cooler cells run efficiently, but freeze-thaw adds stress | Small modifier based on snowbelt setting |
| Ground mount with clear ventilation | -0.05% to -0.02% | Air circulation reduces thermal stress | Subtracts a small amount from annual loss |
🏠Common Home Solar Project Sizes
| Array profile | DC size | First-year energy at 1350 kWh/kW | Energy after 25 years at 0.5% annual loss |
|---|---|---|---|
| Garage or workshop offset | 3 kW | 4,050 kWh/year | About 3,420 kWh/year |
| Small all-electric apartment | 5 kW | 6,750 kWh/year | About 5,700 kWh/year |
| Typical suburban roof | 8 kW | 10,800 kWh/year | About 9,120 kWh/year |
| Whole-home and EV support | 12 kW | 16,200 kWh/year | About 13,680 kWh/year |
| Large home with heat pumps | 16 kW | 21,600 kWh/year | About 18,240 kWh/year |
🧾Warranty Spec Comparison Grid
| Warranty style | Year 1 allowance | Annual allowance | Year 25 retained output |
|---|---|---|---|
| Premium linear output warranty | 1% to 2% | 0.25% to 0.35% | 90% to 92% |
| Strong n-type residential warranty | 1% to 2% | 0.40% to 0.45% | 88% to 89% |
| Standard mono residential warranty | 2% to 3% | 0.50% to 0.60% | 82% to 86% |
| Older stepped output warranty | 3% to 5% | Step-based bands | 80% to 82% |
| Unknown or mixed replacement panels | 2% to 4% | 0.55% to 0.75% | 78% to 84% |
💡Calculation Tips
Solar panel experience a process called degradation. Degradation is the term for the slow loss of power output from solar panels over a long periods of time. The panels dont simply cease to functioning; rather, they experience a slow loss of power output each year due to degradation.
While the process of degradation is inevitable with solar panels, the rate at which they degrade depend upon the chemistry of the panels and the environment in which they are installed. One form of degradation is called light induced degradation. Light-induced degradation occur almost immediately after the installation of solar panels.
Why Solar Panels Lose Power
During this period, the power output of solar panels decrease slightly during the first year of operation of the panels. After this initial year, however, the panels power output gradually decreases at a linear rate. The rate of light-induced degradation is more different than different types of solar panel technologies.
For instance, solar panel manufacturers makes N-type panels, such as TOPCon and HJT panels, that are more stable than the older polycrystalline panels. As a result, N-type panels lose less power over time than polycrystalline panels. The environment in which the panels are installed can also affect the rate at which they degrade.
For instance, heat increase the rate of degradation for solar panels. If solar panels are mounted flush against a roof, the panels may trap heat from the roof. Such trapped heat will accelerate the breakdown of the chemicals in the solar panels.
The higher the temperature of the solar panels, the fasterer the panels degrade in comparison to panels that are cooler to the touch. Providing ventilation beneath the solar panels will reduce the rate at which the panels degrade; an air gap under the panels allow for air to circulate underneath the panels, keeping the panels cooler. It is important to distinguish between degradation and soiling.
Degradation is a permanent loss of power from solar panel technologies; soiling, on the other hand, is a temporary loss in the power of the panels due to the presence of foreign particle on the panels surfaces. Should the power of you’re solar panel decrease, it may be due to soil accumulation rather than degradation. If the solar panels are cleaned of these particles, the power output will return, but degradation cannot restore the power that was lost.
The manufacturers of solar panel technologies provide warranty for their products. These warranties guarantee the percentage of power output of the panels after twenty-five years. One type of warranty is a linear output warranty; such warranties indicates the percentage of power output that the panels will lose each year.
By comparing the actual power output of your panels to that guaranteed by the warranty, you can determine if the solar panels are underperforming relative to expected performance due to degradation and due to the enviroment in which they are installed. Other types of energy loss occur within solar panel installation in addition to that caused by degradation. For instance, there is energy loss in the inverters that convert the DC power from the panels to the AC power that can be transported to other electrical device in a home or building.
Furthermore, the inverters may degrade alongside the panels; as they age, they may not efficient convert the DC power from the panels to the AC power that is required by other devices. In some installations, microinverters is placed on each panel. These microinverters allow each panel to operate independently from each other.
Thus, one panel that degrades in performance do not impact the performance of the other panels in the installation. The main goal of installing solar panels is to provide as much power to the structures in which they are installed as possible. While it is impossible to prevent the degradation of solar panel technologies, it is possible to maximize the amount of energy (in kilowatt hours) that they produce.
Providing adequate ventilation and providing regular maintenance to each panel (to remove any foreign particle from the panels) will maximize the power output. Additionally, if the power output of the panels remains within the specifications of the manufacturers warranty, the panels are performing as they are meant to perform. Thus, the deviation from the guaranteed power output is likely due to degradation of the panels over time.