WiFi Signal Strength Calculator
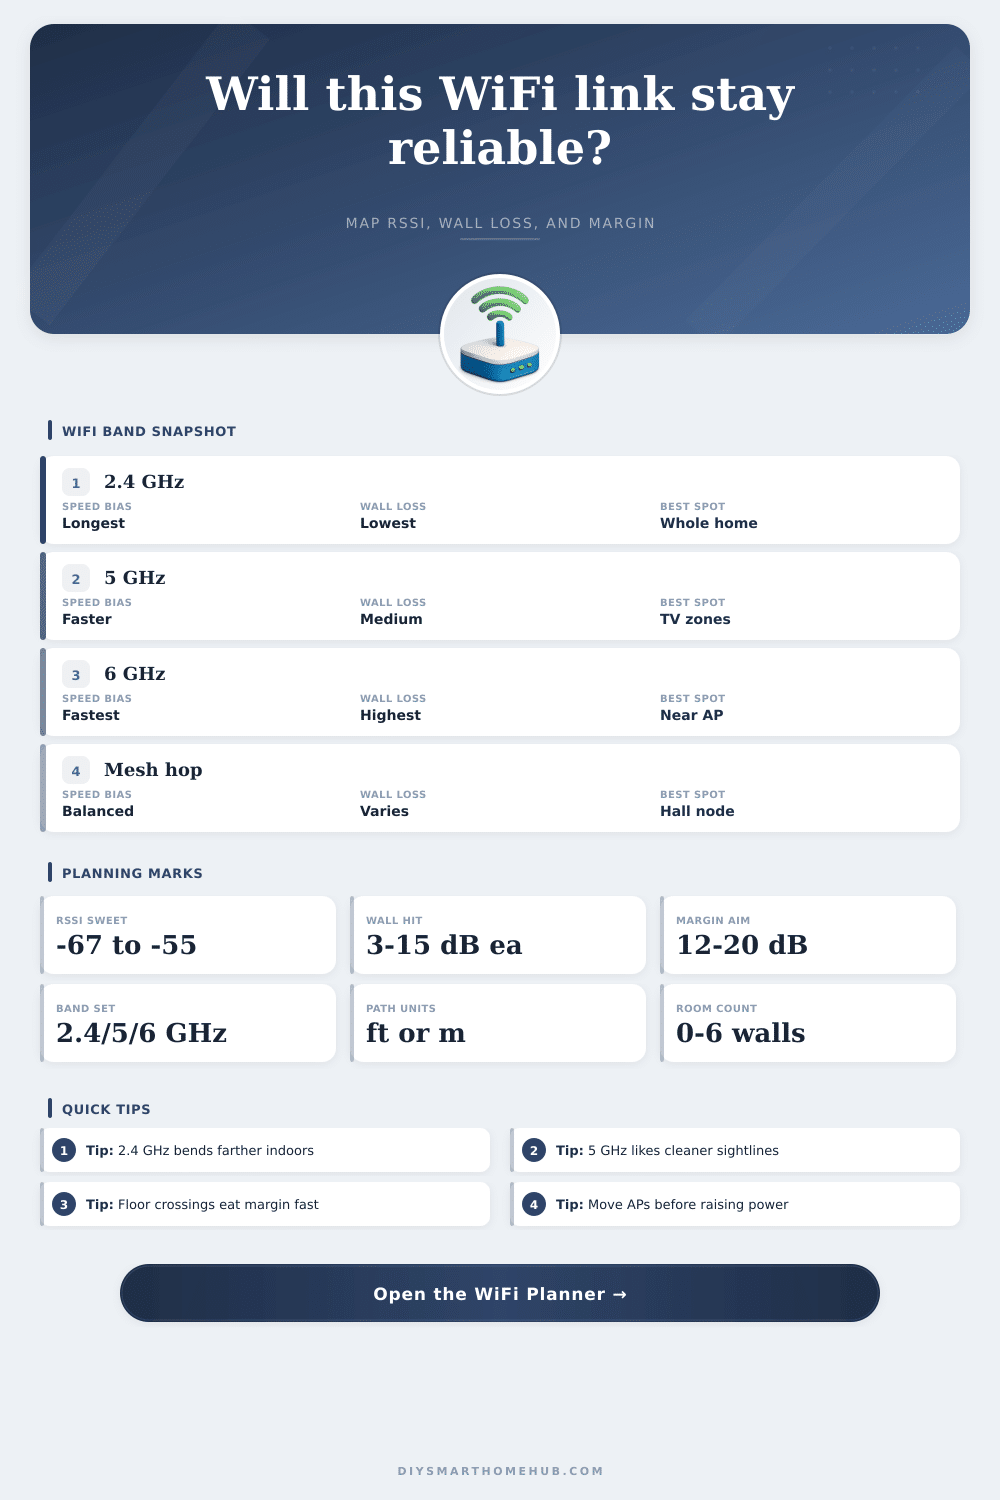
Estimate WiFi RSSI, fade margin, barrier loss, and practical range for 2.4 GHz, 5 GHz, and 6 GHz links before moving an access point, mesh node, camera, laptop desk, or backyard bridge.
| Radio | Typical Band | Healthy RSSI | Common Use |
|---|---|---|---|
| Wi-Fi 2.4 GHz | 2401 to 2473 MHz | -67 dBm or better | General rooms and smart plugs |
| Wi-Fi 5 GHz | 5180 to 5825 MHz | -65 dBm or better | Cameras and higher throughput |
| 6 GHz client | 5955 to 7115 MHz | -62 dBm or better | Nearby premium throughput |
| Directional bridge | 5 GHz outdoor | -60 dBm or better | Garage and outbuilding backhaul |
| Obstacle | Loss Each | Where It Shows Up | Planning Note |
|---|---|---|---|
| Drywall wall | 3 dB | Bedrooms and halls | Two or three walls add up quickly |
| Glass window | 2 dB | Doors and patio glazing | Low-E film can be worse |
| Brick or stone | 7 dB | Exterior walls and chimneys | Hurts higher bands first |
| Concrete or block | 12 dB | Basements and utility cores | Often worth bypassing with mesh |
| Floor crossing | 15 dB | Upstairs and basements | Count every level transition |
| Quality Band | Margin | Behavior | What To Expect |
|---|---|---|---|
| Excellent | 20 dB plus | High reserve | Room for traffic peaks and weather |
| Usable | 12 to 19 dB | Stable daily use | Usually fine if channels stay clean |
| Fringe | 1 to 11 dB | Intermittent dips | Expect retries or lower data rates |
| Failing | 0 dB or less | Below threshold | Needs less loss or more gain |
A couple of brick or concrete crossings can multiply the effective path length several times. That is why moving an access point or mesh node often beats simply raising transmit power.
If the model barely clears sensitivity, real life can still fail during busy hours or client movement. A mesh relay, better AP placement, or a lower-loss band is usually the smarter fix.
A link budget is teh mathematical calculation that determines the strength of the signal between the transmitter and the receiver for wireless signals. Using the link budget, engineers can calculate the loss of strength that the signal will lose as it travels through the space. A wireless signal dont travel through the room without overcoming a variety of obstacles in its path.
These obstacles will cause the signal to weaken in strength, which is referred to as signal attenuation. The link budget has to account for signal attenuation to properly calculate the strength of the signal between the transmitter and the receiver. The frequency of the signal will also impact the strength of the signal between the transmitter and the receiver.
Link Budget and Wireless Signal Loss
Signals at 2.4 GHz has a longer range and will pass through walls more easy than higher frequencies, but the data speeds are slower for those on the 2.4 GHz band. The 5 GHz and 6 GHz bands can provide faster data speeds but have a shorter range because various object in the environment blocks the signals more easy. Various object in the environment can block wireless signals, such as drywall, brick, concrete, or glass.
Placing a wall between the wireless signal emitter and the device receiving the signal can lead to a loss of 3 dB for an typical interior wall. This 3 dB loss means that the signal strength has been cut in half. Different materials will absorb more energy then others.
Therefore, engineers must account for every obstacle the signal will encounter. The environment of the wireless signal will impact the strength of the signal. Open spaces will allow the signal to weaken in strength, but only to a certain degree.
In a crowded space, the signal will weaken at a faster rate. All the objects in the environment will block part of the signal, leading to additional signal attenuation. Engineers must account for this when calculating the link budget.
Engineers will also have to account for the sensitivity of the device receiving the signal. Devices with low sensitivity will require a stronger signal to establish a connection. Another factor that engineers consider when calculating the link budget is the fade margin.
The fade margin is the difference between the strength of the received signal and the minimum signal strength that the receiving device require. The fade margin should be between 12 and 20 dB. Using this fade margin, the signal will remain stable even in the presence of interference from other devices in the area.
If the fade margin is too low, the signal will encounter interference, leading to the drop of the wireless connection or the decrease of data speeds. Other devices in the area that can cause interference include Bluetooth devices and microwave oven. These devices will require a fade margin adjustment of 4 to 8 dB.
For wireless signals, engineers should focus on the line of sight between the access point and the receiving device. The access point should be placed in a central location in a high place to minimize the obstacles in the path of the signal. Thick walls can block wireless signals, so the location of the access point may have to be changed to ensure it is not blocked by any obstacle.
Use the 2.4 GHz band for devices that require a longer range to the access point and use the 5 GHz and 6 GHz for tasks that require high data speeds but dont need to range as far from the access point. Engineers can ensure that the signal is stable throughout the area by calculating the link budget and maintaining the proper fade margin.