Refrigerant CO2 Equivalent Calculator
Convert refrigerant charge, release share, recovery efficiency, and fleet count into event and annual CO2e totals for service logs, decommissioning plans, and emissions tracking.
📌Scenario Presets
⚙CO2e Inputs
Calculated CO2e Snapshot
Select a preset or enter measured charge data to estimate released mass, captured mass, and total CO2e.
📊Selected Refrigerant Spec Grid
R-410A
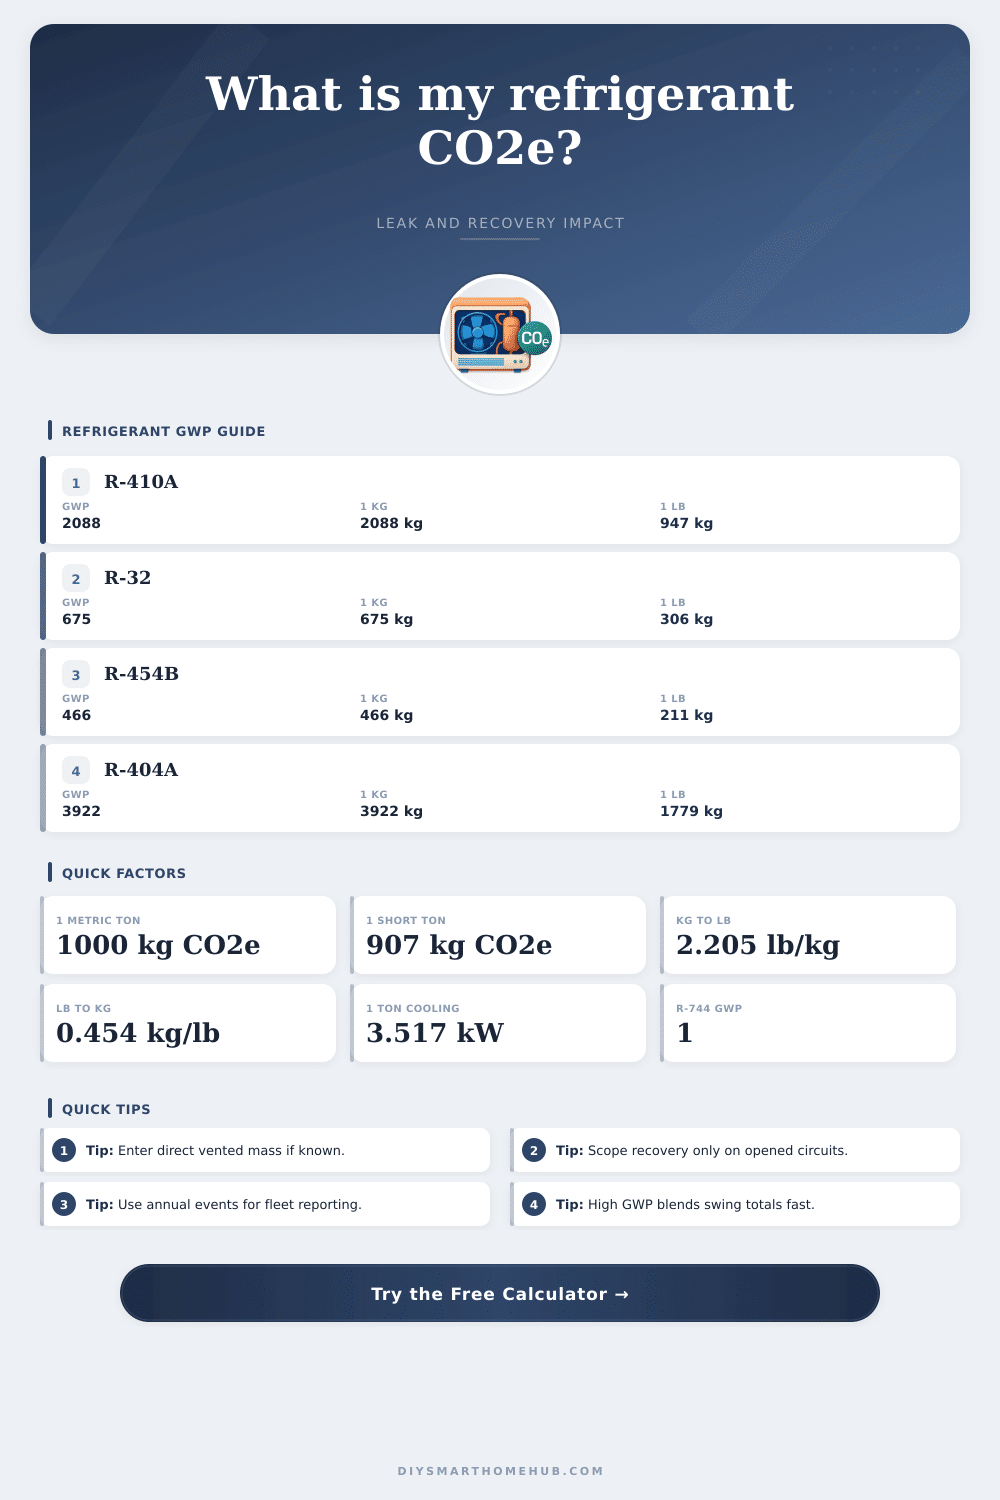
📘Refrigerant GWP Reference
| Refrigerant | 100-Year GWP | Safety | Typical Application |
|---|---|---|---|
| R-410A | 2088 | A1 | Residential split and heat pump |
| R-32 | 675 | A2L | Mini-split and VRF |
| R-454B | 466 | A2L | Low-GWP split replacement |
| R-134a | 1430 | A1 | Small chillers and beverage cooling |
| R-404A | 3922 | A1 | Commercial freezer rack |
| R-448A | 1387 | A1 | Cold room retrofit |
| R-449A | 1397 | A1 | Medium temp retrofit |
| R-507A | 3985 | A1 | Low-temp rack and transport |
| R-513A | 631 | A1 | Chiller retrofit and medium temp duty |
| R-744 (CO2) | 1 | A1 | Transcritical and cascade receiver |
🚨Leak and Recovery Benchmarks
| Event Pattern | Leak Share | Recovery Scope | Typical Meaning |
|---|---|---|---|
| Micro leak top-off | 5% to 10% | 0% to 25% | Minor seep, system remains charged |
| Coil or braze repair | 15% to 35% | 60% to 100% | Recover the remaining charge before opening |
| Compressor swap | 20% to 40% | 80% to 100% | Most remaining charge can be captured |
| Retrofit or decommission | 0% to 10% | 95% to 100% | Planned recovery dominates total footprint |
| Catastrophic rupture | 80% to 100% | 0% to 20% | Very little charge remains to recover |
♻Recovery Efficiency Impact
| Recovery Rate | Uncaptured Portion | CO2e Effect | Best Used For |
|---|---|---|---|
| 70% | 30% of routed mass | Large residual footprint | Rough field estimate |
| 80% | 20% of routed mass | Material emissions remain | Average service pull |
| 90% | 10% of routed mass | Strong capture performance | Routine recovery with scale |
| 95% | 5% of routed mass | Low service loss | Planned retrofit or teardown |
| 98% | 2% of routed mass | Near-max capture | Audited recovery process |
📋Preset Scenario Benchmarks
| Scenario | Charge per Circuit | Event CO2e | Annual CO2e |
|---|
Track charge by sealed circuit, not by rooftop or store total. Per-circuit mass is what makes release share, recovery scope, and yearly fleet multipliers stay accurate.
When direct vented mass is known from a cylinder scale or reclaim log, enter it in the override field. That prevents percentage guesses from inflating or understating CO2e.
Refrigerant has a significant impact on the atmosphere due to its Global Warming Potential. Refrigerant’s Global Warming Potential indicate how much CO2 equivalents is released into the atmosphere from the venting of refrigerant. When refrigerant is vented into the atmosphere, the amount of CO2 equivalents are released.
Furthermore, because the Global Warming Potential of refrigerants is extremely high compared to CO2, the loss of even a small amount of refrigerant can result in the release of a significant amount of CO2 equivalents. Therefore, to control refrigerant losses and the resulting amount of CO2 equivalents released into the atmosphere, it is necessary to track the refrigerant loss. Refrigerants has varying Global Warming Potentials.
Why Track Refrigerant Loss
High GWP refrigerants, such as R-404A, have a much higher potential to impact the atmosphere then low-GWP refrigerants, such as R-32 or R-454B. Additionally, refrigerants like carbon dioxide (R-744) have a GWP of 1, indicating their very low impact on the atmosphere relative to other refrigerant. Because each refrigerant have a different GWP, it is necessary to calculate the amount of CO2 equivalents released by identifying the type of refrigerant that is released.
Refrigerant losses is common during service events. During a service event, technicians often lose refrigerant when they perform a top-off to refill the systems refrigerant loss. Additionally, refrigerant may be lost if the technician dont use refrigerant recovery equipment to remove the refrigerant from the system.
In this case, the technician will lose refrigerant to the atmosphere. Using refrigerant recovery equipment will allow technician to capture as much refrigerant as possible from the system. The percentage of refrigerant that can be captured is referred to as the recovery efficiency.
A recovery efficiency of 95% means that most of the refrigerant was captured, whereas a recovery efficiency of 70% mean that a significant amount of refrigerant was lost to the atmosphere. Refrigerant loss should be measured on a per circuit basis instead of measuring the refrigerant loss for an entire HVAC system. HVAC systems contains several circuits with refrigerant in each circuit.
By measuring the refrigerant loss for the entire HVAC system, you wont accurately measure the refrigerant loss for each circuit. You can use a refrigerant scale to accurately measure the refrigerant loss for each circuit. By accurately measuring the refrigerant loss, it is possible to calculate the amount of CO2 equivalents released during that service event.
Refrigerant management is changing due to new regulation and goals. For instance, the EPA’s AIM Act will significantly reduce the production of high GWP refrigerants, forcing HVAC technicians to track their refrigerant usage. Additionally, many HVAC companies have set environmental sustainability goals that require refrigerant loss log to measure their impact on the atmosphere.
Due to these increasing regulations, HVAC technicians must track refrigerant loss to meet the requirement of their companies. By tracking refrigerant loss and recovery efficiency, HVAC technicians can better control the amount of CO2 equivalents released into the atmosphere by their refrigerant fleet.