🌍 Product Carbon Footprint Calculator
Estimate the lifecycle CO₂e emissions of your product — from raw materials to end-of-life
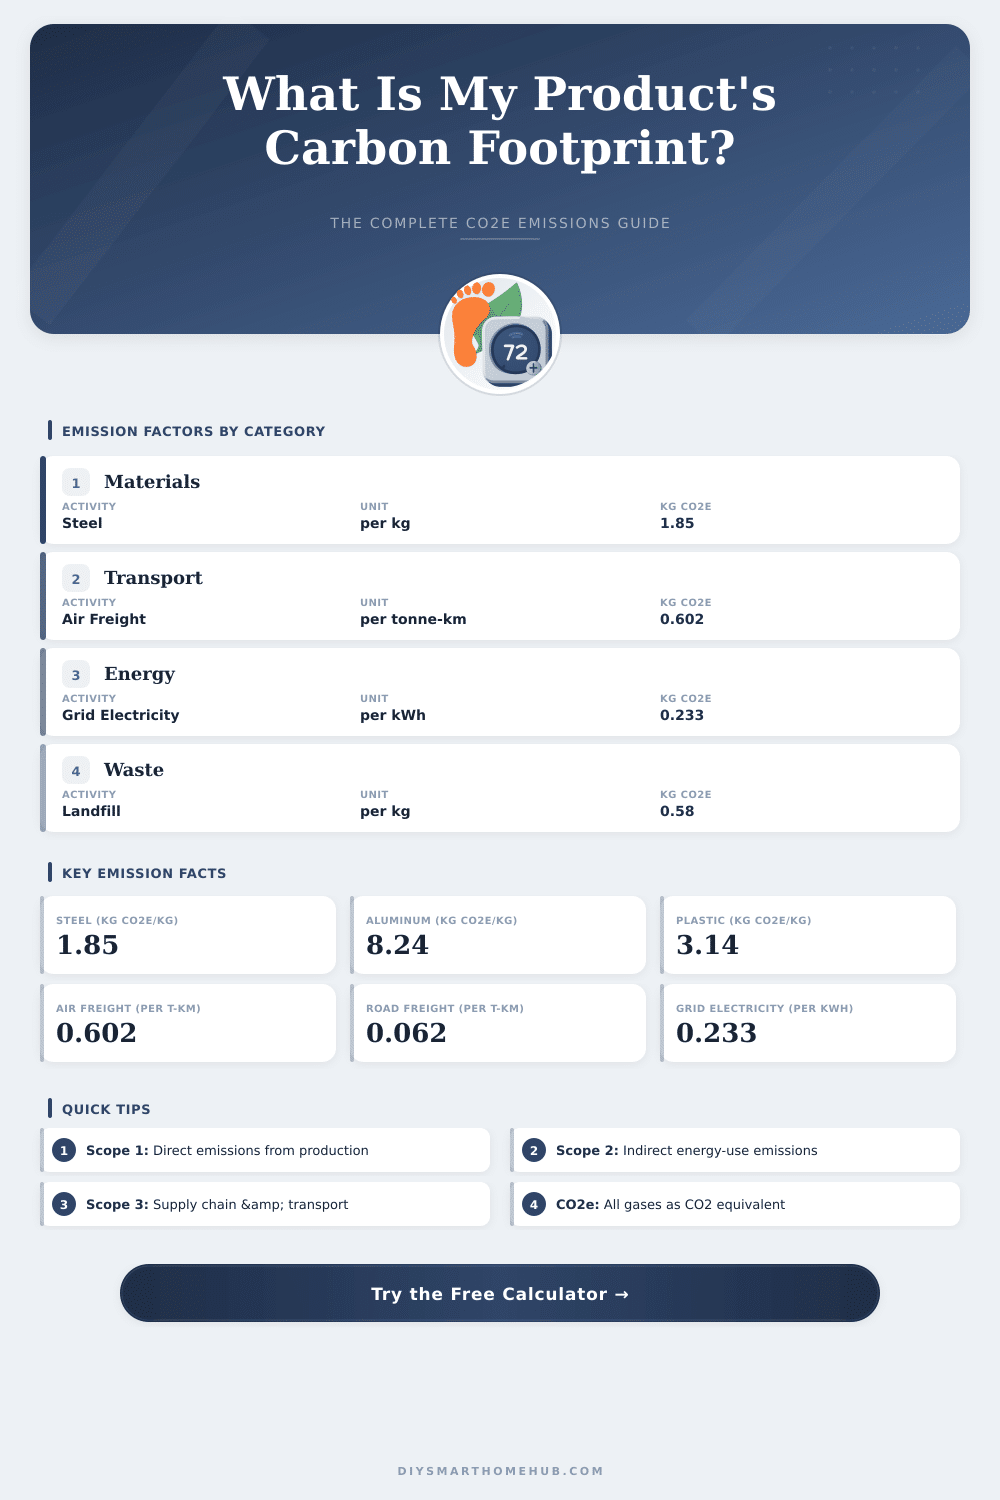
kg CO₂e/kg
kg CO₂e/kg
kg CO₂e/kg
kg CO₂e/kg
kg CO₂e/kg
kg CO₂e/kg
kg CO₂e/kg
kg CO₂e/kg
| Transport Mode | kg CO₂e per tonne-km | kg CO₂e per lb-mile | Typical Range |
|---|---|---|---|
| Sea Freight | 0.016 | 0.0000051 | 0.010–0.025 |
| Air Freight | 0.602 | 0.000191 | 0.400–0.800 |
| Road – HGV Truck | 0.062 | 0.0000197 | 0.050–0.130 |
| Road – Light Van | 0.205 | 0.0000651 | 0.150–0.300 |
| Rail Freight | 0.028 | 0.0000089 | 0.015–0.040 |
| Region / Source | kg CO₂e per kWh | Relative to Global Avg | Notes |
|---|---|---|---|
| Global Average | 0.233 | Baseline | IEA 2023 estimate |
| United States | 0.386 | +66% | EPA eGRID 2022 |
| European Union | 0.275 | +18% | EEA 2022 average |
| China | 0.555 | +138% | IPCC national data |
| India | 0.708 | +204% | High coal dependency |
| Renewable Energy | 0.011 | -95% | Solar / Wind LCA avg |
| Natural Gas | 0.202 | -13% | Direct combustion |
| Coal | 0.820 | +252% | Direct combustion |
| Disposal Method | kg CO₂e per kg waste | Net vs Landfill | Notes |
|---|---|---|---|
| Landfill | 0.58 | Baseline | Includes methane leakage |
| Recycled | -0.45 | -178% | Credit for avoided production |
| Incinerated (energy recovery) | 0.21 | -64% | Replaces some fossil fuel |
| Composted | 0.10 | -83% | Organic materials only |
| Reused / Refurbished | -1.20 | -307% | Avoids new product mfg |
| Product | Total kg CO₂e | Largest Stage | Key Hotspot |
|---|---|---|---|
| Cotton T-Shirt | 5.0–8.0 | Materials (50%) | Cotton farming water & fertilizer |
| Denim Jeans | 20–33 | Materials (40%) | Cotton + dyeing process |
| Smartphone | 55–86 | Manufacturing (75%) | Chip fabrication energy |
| Laptop Computer | 200–400 | Manufacturing (80%) | PCB & display production |
| Glass Bottle (750ml) | 0.48–0.72 | Materials (60%) | Melting furnace energy |
| PET Plastic Bottle (500ml) | 0.08–0.15 | Materials (55%) | Petrochemical feedstock |
| Office Chair | 72–145 | Materials (65%) | Steel & foam components |
| Cardboard Box (medium) | 0.4–0.9 | Materials (70%) | Pulp production |
The Carbon footprint of a product, usually called PCF, estimates the whole greenhouse gas issues linked to a product during its whole life cycle. It covers everything from the pulling out of materials and the factory until transfer, usage and disposal. Those issues one measures by means of kilos of CO₂-match, sometimes written as kg CO₂e, and one can count that for any product.
The life cycle that one covers is quite complete. Gain of materials, processing, production, distribution, storage, usage and end of life everything enters in the calculation. Basically, from the moment when materials exit from the ground until when the product dumps or recycles one traces the issues.
What is a Product Carbon Footprint?
Why does that happen? The rating of issues during the whole life cycle of a product helps companies make better choices, back their environmental statements and stay in line with changing climate rules. That goes beyond simply green motion.
It offers to companies strategic, financial and proof-based profit, while it helps them truly lower their environmental traces.
Some companies already practise this. Makers use tools like CarbonChain for delivering reliable Carbon footprints of products, that one shows at point of purchase or delivery. The footprint can appear as whole issues or as intensity of issues.
One chemical company applies something called the Climatic engine for following cuts of issues at product level, which surpirses improvements in its supply chain and in its own activities. Now most of its products come with calculations of Carbon footprint, that lines up with ISO 14067 and the Guideline Together for Sustainability.
Other big companies always work to lower the PCF of there products. They bring openness by means of asking suppliers about data of their own PCF for materials. Based on that, the Carbon footprint of a product becomes an extra factor during choice of materials, one chooses those with lower footprints.
The usual standards for such calculations carry the Protocol about Greenhouse Gases, ISO 14067 and PAS 2050. Factors of issues commonly come from government sources or from third-party services like ecoinvent. When companies make public statements about footprints of their products, they most commonly issue a report, that explains how one counted everything.
Software tools are useful when products are complex or when one needs to track hundreds ofdifferent products.
The sharing of such data is also important. Schneider Electric and the World Economic Forum research how sharing of data about PCF forms a key stage for cutting issues and for improving ratings of life cycles. The Partnership for Carbon Openness works for boosting low-Carbon goals by means of opening of data about issues across value chains.
Many brands now announce the Carbon footprints of their products, and buying of used, reusable or low-emission products helps to lower waste.