☀️ Solar Panel Efficiency Calculator
Estimate daily & annual power output from your solar array based on panel specs, area, and sun hours
| Region | State Examples | Peak Sun Hrs/Day | Annual kWh per kW |
|---|---|---|---|
| Southwest Desert | AZ, NM, NV | 5.5 – 6.5 | 1,900 – 2,300 |
| Southeast | FL, GA, TX | 4.5 – 5.5 | 1,500 – 1,900 |
| California Coast | CA (coastal) | 4.5 – 5.5 | 1,500 – 1,900 |
| Midwest | IL, MO, KS | 4.0 – 4.8 | 1,300 – 1,600 |
| Mid-Atlantic | VA, MD, NC | 4.0 – 4.5 | 1,300 – 1,500 |
| Northeast | NY, MA, CT | 3.5 – 4.2 | 1,100 – 1,400 |
| Pacific Northwest | WA, OR | 3.0 – 3.8 | 1,000 – 1,250 |
| Alaska / Canada | AK, Canada | 2.5 – 3.5 | 800 – 1,100 |
| System Size | Panels (400W) | Daily Output (4 PSH) | Annual Output |
|---|---|---|---|
| 1 kW | 3 panels | ~3.4 kWh/day | ~1,240 kWh/yr |
| 2 kW | 5 panels | ~6.9 kWh/day | ~2,520 kWh/yr |
| 3 kW | 8 panels | ~10.3 kWh/day | ~3,760 kWh/yr |
| 5 kW | 13 panels | ~17.2 kWh/day | ~6,280 kWh/yr |
| 7 kW | 18 panels | ~24.1 kWh/day | ~8,800 kWh/yr |
| 10 kW | 25 panels | ~34.5 kWh/day | ~12,600 kWh/yr |
| 15 kW | 38 panels | ~51.7 kWh/day | ~18,900 kWh/yr |
| 20 kW | 50 panels | ~69.0 kWh/day | ~25,200 kWh/yr |
| Tilt Angle | Best Latitude | Relative Output Factor | Notes |
|---|---|---|---|
| 0° (flat) | 0° (equator) | 0.87 | Good in tropics only |
| 10° | 10° | 0.90 | Low pitch rooftops |
| 20° | 20° | 0.95 | Mild climate regions |
| 30° | 30° (optimal US South) | 1.00 | Reference standard |
| 35° | 35° | 1.00 | Most US rooftops |
| 40° | 40° | 0.98 | Typical US North |
| 45° | 45° | 0.96 | Steep roofs |
| 60° | 60° (Nordic) | 0.88 | High latitudes |
| Loss Source | Typical Range | High-Quality System | Older System |
|---|---|---|---|
| Inverter Conversion | 4 – 6% | 3 – 4% | 6 – 8% |
| Wiring / DC Resistance | 1 – 3% | 1% | 2 – 3% |
| Temperature Derating | 3 – 7% | 3% | 5 – 8% |
| Soiling / Dust | 1 – 5% | 1% | 4 – 5% |
| Mismatch | 1 – 2% | 1% | 2% |
| Shading | 0 – 30% | 0% | Varies |
| Total (excl. shading) | 10 – 23% | 9 – 11% | 19 – 26% |
The efficiency of a Solar Panel comes down to one main spot: how many percent of the incoming sunshine truly turn into usable electricity. Take for instance a panel with 20% efficiency. That means that one from five parts of the sun energy that hits its surface turns into usable energy.
You might think that is low but it is quite a lot like the efficiency of a piston engine, that turns burning into motion.
How Solar Panels Turn Sunlight Into Power
Progress in the last ten years was truly wonderful. The typical efficiency of panels grew from about 15% to more than 23%. This shows big breakthroughs.
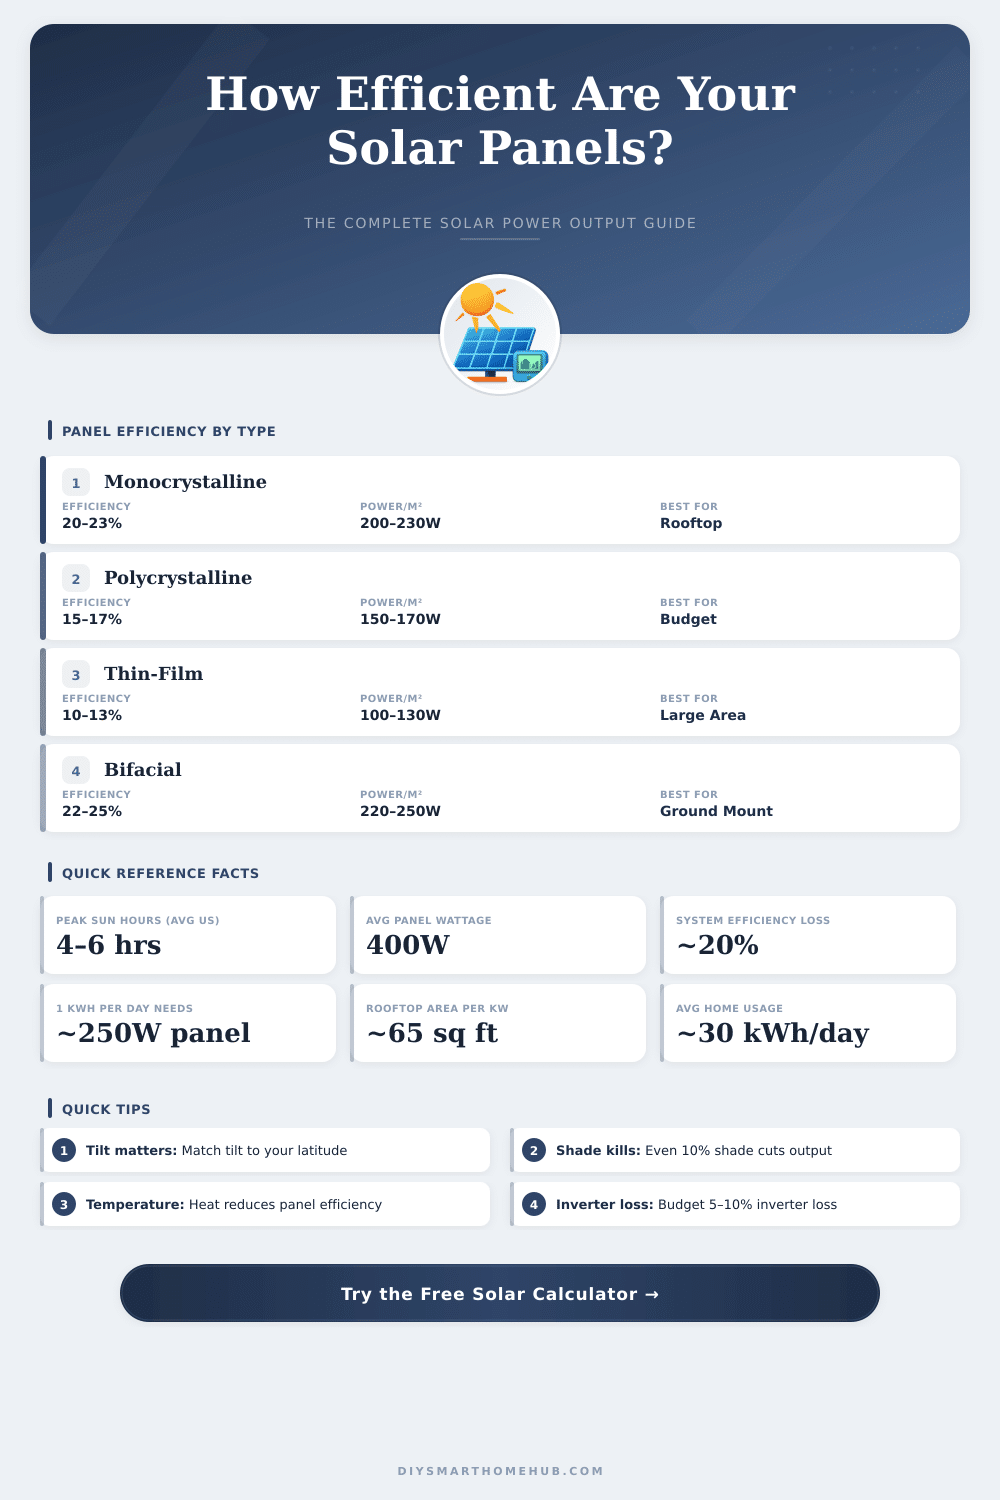
Current panels for sale usually have efficiency between 15% and 22%. Single crystal silicon panels reach 22-23%, while polycrystalline versions mostly stay at 15-17%. Here exists a trade-off.
Polycrystalline panels commonly have shorter lifetime and do not work as well over long time.
Some producers already reach higher levels. The N-type TOPCon cell of Trina Solar marks 25.9%. The Tiger Neo 3.0 of Jinko Solar reached 24.8%, and the HI-MO6 of Longi is at 23.3%.
Thsoe values simply keep growing.
In labs, the results become truly exciting. Scientists succeeded with cells that get close to 50% efficiency, where the highest record is 40.6%. But here comes a limit; the second law of thermodynamics lays a hard ceiling above everything.
A Solar Panel cell can not reach 100% efficiency, end of story. Hybrid perovskite-silicon cells already reached 33.2% and a theoretical limit of 37-38%. Add a third layer on top, and you can hope for 40% or more.
Work on layered cells that react to different wavelengths and let unused light pass threw to other layers can give even more energy.
Temperature strongly affects the efficiency. When panels warm, their output drops. Silicon cells lose around 0.45% of power for every degree of temperature increase.
Strangely, panels work better in cold, sometimes they boost by 10-15%. Pretty funny, if you think about it.
The position of panels matters more than one assumes. Tilt it at 45 degrees to the sun, and it beats a flat setup. Local conditions also play a role.
In Detroit, at about 42.8 degrees north, the sun reaches 47.2 degrees above the horizon at midday March 21st, which gives only 73% of the rated efficiency under ideal conditions. Smoke and clouds really hurt the output. Australian rooftop panels lost up to 45% of production during dense smoky days.
In California it happened the same way, smoke and ash dropped efficiency by 35% or more.
High efficiency truly matters only when space is tight. A 300-watt panel gives 300 watts anyway, but a 22% model needs less roof area than a 15% one for the same power. Multi-layer panels cost much more to produce thansingle-layer ones, so the best efficiencies come with a high price.