☀️ Solar Panel Power Output Calculator
Estimate daily & annual energy generation based on your panel specs, location, and system setup
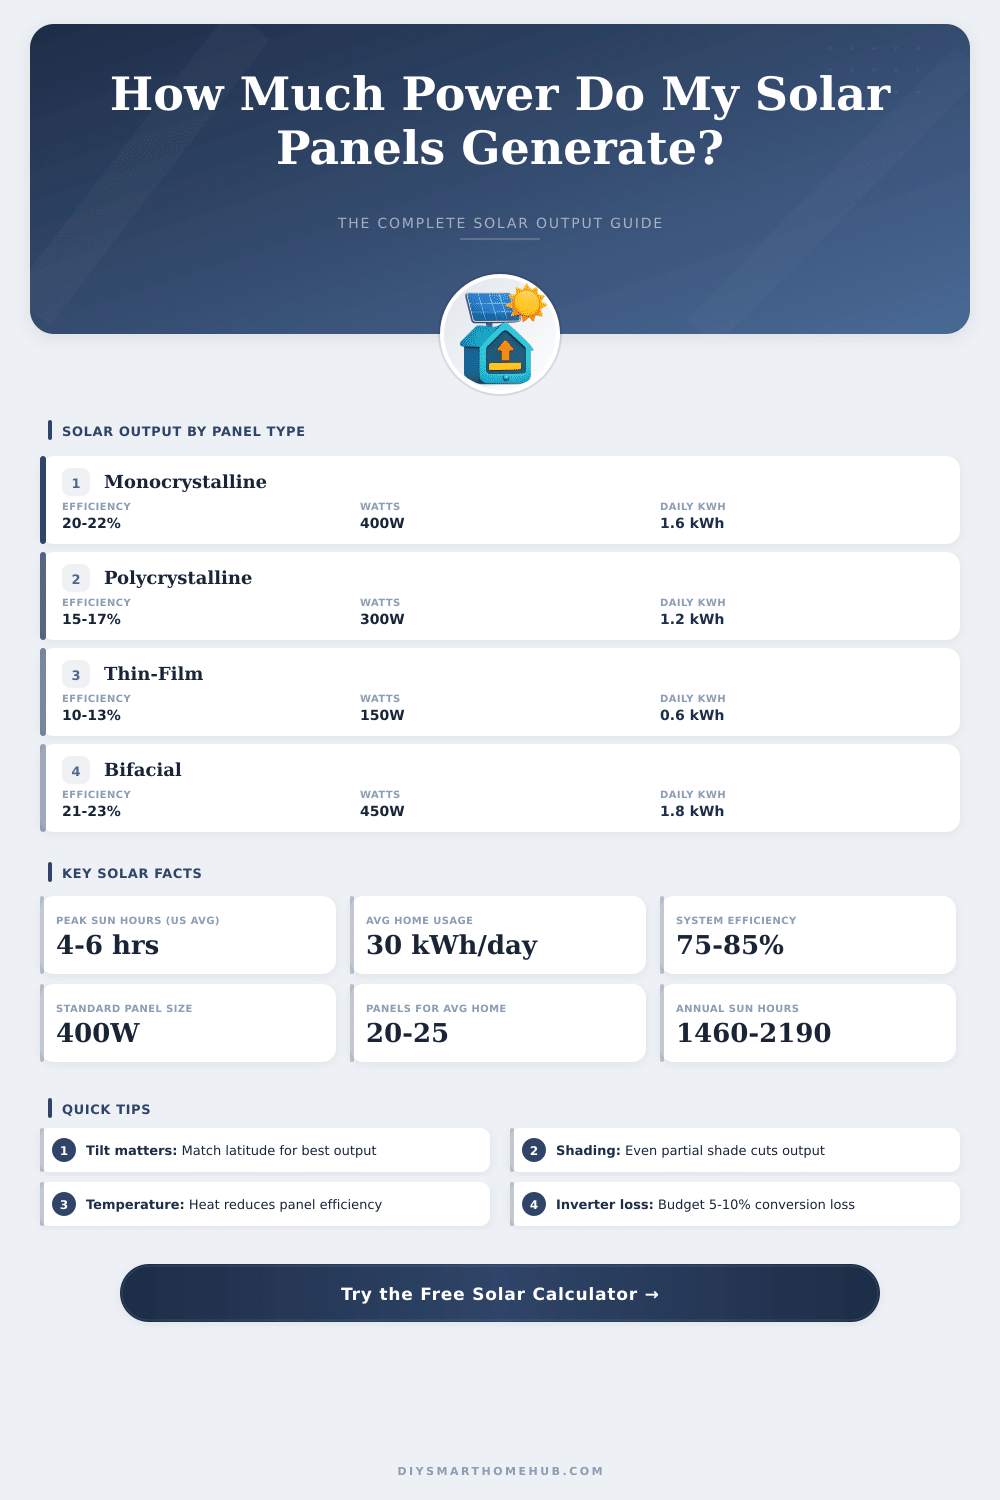
350-450W typical
250-350W typical
100-200W typical
400-550W typical
380-440W typical
400-460W typical
410-470W typical
50-200W typical
| Region / City | Avg Peak Sun Hrs/Day | Annual Sun Hours | Best Season |
|---|---|---|---|
| Southwest (Phoenix, AZ) | 6.0 – 7.5 | 2,190 – 2,737 | Year-round |
| California (Los Angeles, CA) | 5.5 – 6.5 | 2,007 – 2,372 | Apr – Oct |
| Southeast (Miami, FL) | 5.0 – 6.0 | 1,825 – 2,190 | Mar – Sep |
| Texas (Dallas, TX) | 5.0 – 5.8 | 1,825 – 2,117 | Apr – Sep |
| Mid-Atlantic (New York, NY) | 4.0 – 4.8 | 1,460 – 1,752 | May – Aug |
| Midwest (Chicago, IL) | 3.8 – 4.6 | 1,387 – 1,679 | May – Aug |
| Pacific NW (Seattle, WA) | 3.0 – 4.0 | 1,095 – 1,460 | Jun – Aug |
| Northeast (Boston, MA) | 3.5 – 4.5 | 1,277 – 1,642 | May – Aug |
| Mountain (Denver, CO) | 5.0 – 6.0 | 1,825 – 2,190 | Apr – Sep |
| Hawaii (Honolulu, HI) | 5.5 – 7.0 | 2,007 – 2,555 | Year-round |
| Panel Wattage | Daily Output (kWh) | Monthly Output (kWh) | Annual Output (kWh) |
|---|---|---|---|
| 100W | 0.40 kWh | 12 kWh | 146 kWh |
| 200W | 0.80 kWh | 24 kWh | 292 kWh |
| 300W | 1.20 kWh | 36 kWh | 438 kWh |
| 350W | 1.40 kWh | 42 kWh | 511 kWh |
| 400W | 1.60 kWh | 48 kWh | 584 kWh |
| 450W | 1.80 kWh | 54 kWh | 657 kWh |
| 500W | 2.00 kWh | 60 kWh | 730 kWh |
| 600W | 2.40 kWh | 72 kWh | 876 kWh |
| System Size | Panels (400W) | Daily Output | Annual Output |
|---|---|---|---|
| 3 kW System | 7-8 panels | 12 kWh/day | 4,380 kWh/yr |
| 5 kW System | 12-13 panels | 20 kWh/day | 7,300 kWh/yr |
| 6 kW System | 15 panels | 24 kWh/day | 8,760 kWh/yr |
| 8 kW System | 20 panels | 32 kWh/day | 11,680 kWh/yr |
| 10 kW System | 25 panels | 40 kWh/day | 14,600 kWh/yr |
| 12 kW System | 30 panels | 48 kWh/day | 17,520 kWh/yr |
| 15 kW System | 37-38 panels | 60 kWh/day | 21,900 kWh/yr |
| 20 kW System | 50 panels | 80 kWh/day | 29,200 kWh/yr |
Sun panels come with a big rating that shows their biggest output under ideal test conditions. Usually one marks it as Pmax on the data sheet, measured in watts. The testing is very precise: it requires exactly 1000 watts per square metre of light that hits the glass surface, while the temperature stays at a cool 25 degrees Celsius with a light spectrum that copies real sunlight.
Like this the shown number is only the best possible case not what you will find on your roof.
Why Solar Panels Give Less Power Than Their Rating
In real life, a solar panel commonly gives around 400 watts when the sun shines directly on it, and it can make around 2 kilowatt hours of energy during one day. Output changes a bit based on the model of the panel and the maker. One finds around 250 watts at the bottom limit up to 450 watts at the upper.
Efficiency numbers add extra change; the most common panels today have efficiency betwen 15% and 30%, and that range really affects what you get actually.
Here is something to think about. Assume two panels, both with 20% efficiency. One rated at 350 watts, the other at 400 watts.
That 400 watt panel? It is almost 14% bigger physically. So the efficiency alone does not tell the whole picture.
To estimate the everyday energy output, one multiplies the power of the panel by the number of peak sun hours in your region. Many things play a role however, the angle of the roof, the direction it faces, whether trees cast shade, and the efficiency of the panel, everything affects the actual results. Bigger panels have more cells packed in, so they make more energy.
Their efficiency is usually around 2% higher then that of home models. Another factor is the temperature. If a panel warms more than 10 degrees above the standard 25 degrees Celsius, it loses almost 5% of its power, because the output drops.
What really comes from your panels commonly is less than the rated kind. A 100 watt panel can give only 60 to 80 watts, based on the season and the setup angle. One person with four such panels managed to reach only 290 watts total during a bright sunny day, each panel reached around 60 to 70% of its rating.
Add clouds, and the output falls even to 12 to 17% of the listed number.
Smoke from fires nearby adds extra trouble. Roof systems in Australia had heavy drops of up to 45%, when thick smoke covered the sky. In California, homeowners faced a real toll of 35% or more because of smoke and ash.
The tiny particles in the air absorb the light before it reaches the panels.
Roughly said, every watt of solar panel skill makes around 1,375 kilowatthours yearly. Older panels slowly lose their output over time. Some solar setups replace panels after they reach thebottom 80% of the original output.