Wireless Access Point Range Calculator
Estimate WiFi access point indoor radius, outdoor line-of-sight range, coverage area, link budget, and the number of APs needed for a room, apartment, home, office, garage, or outdoor zone.
📶AP deployment presets
⚙WiFi range inputs
Calculation breakdown
📊AP/radio spec grid
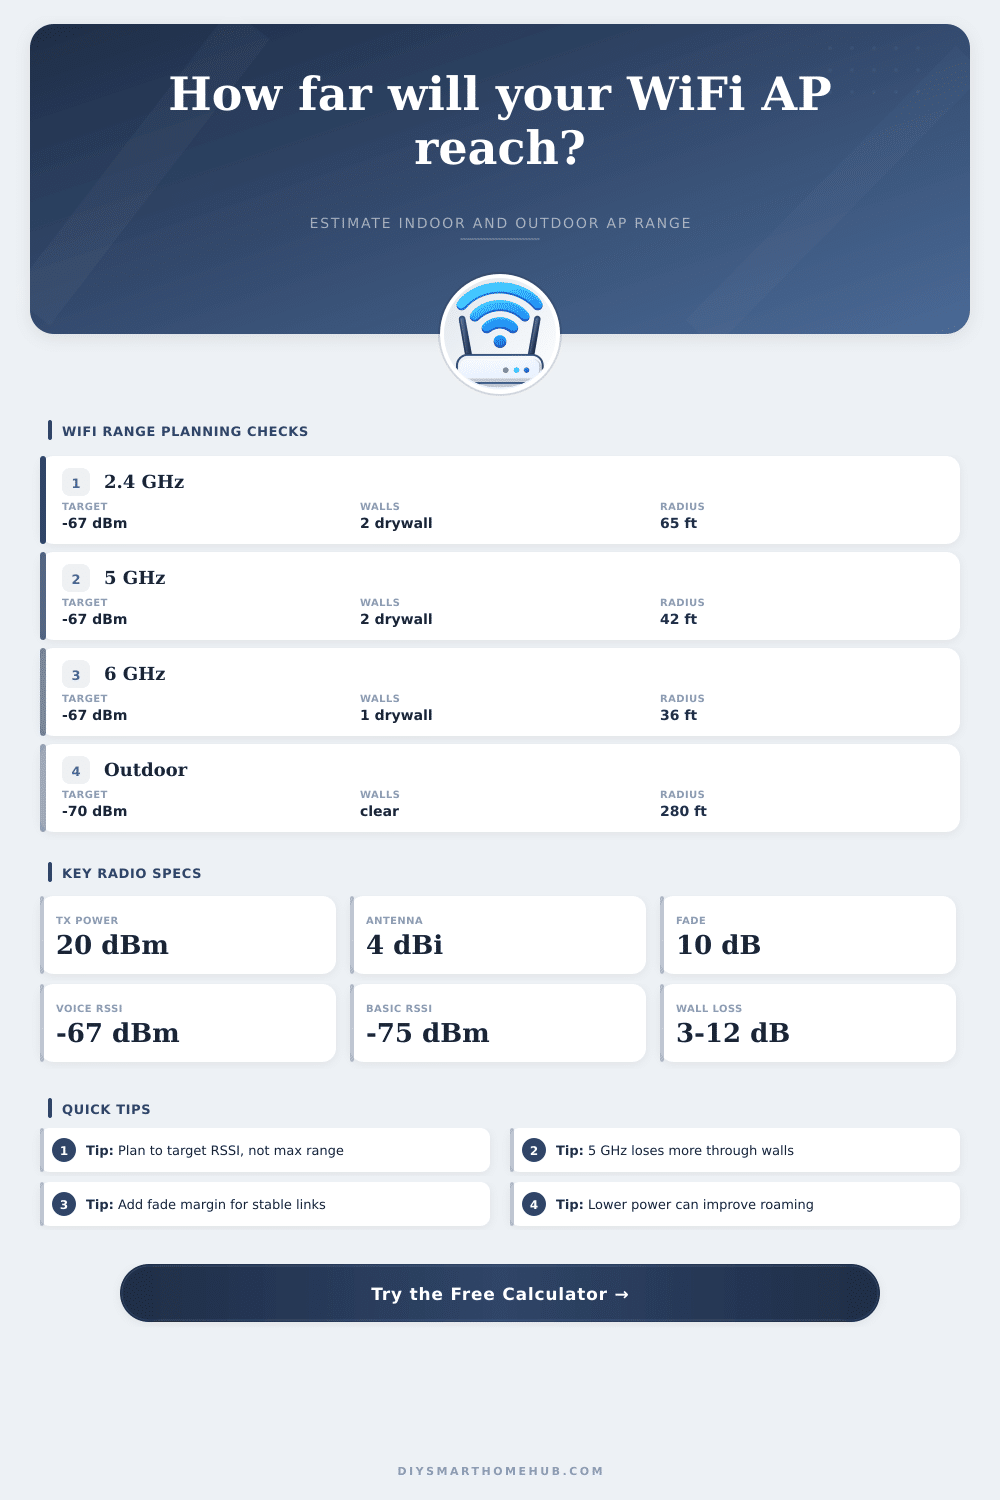
Common per-radio transmit power before antenna gain and cable loss.
Moderate gain spreads coverage without making cells too large.
Planning RSSI commonly used for roaming and real-time traffic.
Headroom for multipath, client orientation, and interference changes.
📋Frequency band path loss table
| Band | Center frequency | FSPL at 10 m | Wall behavior | Typical range use |
|---|---|---|---|---|
| 2.4 GHz | 2400 MHz | 60.0 dB | Best wall penetration | IoT, long reach, low-rate coverage |
| 5 GHz | 5200 MHz | 66.8 dB | Moderate wall penetration | Primary home and office data coverage |
| 6 GHz | 6100 MHz | 68.1 dB | Shortest indoor reach | High capacity rooms and low-interference zones |
| Outdoor 5 GHz | 5200 MHz | 66.8 dB | No walls assumed | Patio, yard, clear line-of-sight APs |
🧱Wall attenuation reference
| Obstacle | Planning loss | 2.4 GHz | 5/6 GHz | Notes |
|---|---|---|---|---|
| Drywall interior wall | 3 to 5 dB | Lower loss | Moderate loss | Common residential partition assumption |
| Wood door or framing | 2 to 4 dB | Lower loss | Moderate loss | Varies with density and metal hardware |
| Brick or dense plaster | 8 to 12 dB | Moderate loss | High loss | Often drives additional AP placement |
| Concrete or block | 12 to 20 dB | High loss | Very high loss | Plan APs per room or per side |
| Low-E glass | 10 to 18 dB | High loss | Very high loss | Metal coatings can block outdoor coverage |
🏠Deployment coverage examples
| Scenario | Band | Target RSSI | Common area | Planning note |
|---|---|---|---|---|
| Single room | 5 GHz | -67 dBm | 150 to 300 sq ft | Usually one AP if walls are light |
| Apartment | 5 GHz | -67 to -70 dBm | 600 to 1000 sq ft | Place AP near the center of active rooms |
| Whole house | 2.4 and 5 GHz | -67 dBm | 1500 to 2500 sq ft | Multiple smaller cells usually roam better |
| Garage IoT | 2.4 GHz | -75 dBm | 300 to 600 sq ft | Low-rate devices tolerate weaker RSSI |
| Outdoor patio | 5 GHz | -70 dBm | 1000+ sq ft | Clear sightlines matter more than floor area |
🔎Receiver sensitivity and RSSI targets
| Use case | Target RSSI | Receiver sensitivity | Data behavior | Calculator use |
|---|---|---|---|---|
| Voice roaming | -67 dBm | -80 to -85 dBm | Needs stable cell overlap | Use target RSSI as the range limit |
| General data | -70 dBm | -82 to -88 dBm | Good browsing and streaming | Balanced planning target |
| IoT sensor | -75 dBm | -88 to -94 dBm | Low throughput tolerated | Range may be sensitivity-limited |
| High throughput | -60 dBm | -70 to -78 dBm | Higher modulation rates | Use smaller, denser AP cells |
💡Range planning tips
That doesn’t mean WiFi range is represented by a perfect circle on your floor plan. Radio signals act in complex ways with everything they encounter. Microwaves, furnitures, drywall, and even the water inside your body can bounce and soak up signals. By entering information about what’s in your space, the calculator do the math for you. Knowing how to read what it spits out allows you to place your hardware without guessing.
The main tradeoff to keep in mind here is frequency. The higher your frequency, the faster your speeds, provided you’re within close proximity of your routers. A 2.4 GHz signal will penetrate walls and go around corners with minimal issues. So you can still get a smart thermostat connect to your router from inside a basement, even though it’s made out of concrete. But the 5 GHz and 6 GHz bands hits physical barriers that really impede the signal. You might find that you can’t send a 5 or 6GHz signal around a massive open-air warehouse. In that case, you’ll have to stick with 2.4GHz.
How to Plan Your WiFi Network
On the flip side, if you’re designing an office space with lots of people and want to prioritize speed over range, you’ll want to go up on the band. The type of wall material really matters. Most folks assume any internal wall is equal but it isn’t. Depending on what it’s made off, it’ll have a different effect. Running your signal through a regular drywall partition can weakens your signal four decibels. Multiply that by however many walls you pass through, and that number quickly gets out of hand. Low-e glass (metalized coatings), brick or concrete walls can all block your signal altogether. As you can see in the reference table, some more dense materials use up your link budget much quicker then others. If you’re building a house with thick masonry walls, don’t expect just one central access point to service the entire property. You’ll find dead spots that the signal won’t be able to reach even at full transmit power.
The other secret variable here is receiver sensitivity. That’s how much of a signal your laptop or phone require to decode those high-speed packets of data without needing repeated attempts. Below a certain level… Known as the received signal strength indicator, you’re toast. The goal is negative sixty-seven decibel. That number becomes more important when you’re doing a video conference call than when you are just checking email in the morning.
There is also some confusion between capacity vs. Coverage. Even though signal strength might be strong in a space, if there are too many device competing for air time, that doesn’t mean it will perform well. The fewer clients any one access point has to handle, the better it will perform; installing additional ones decreases client counts per device. The calculator factors in size of the entire space as well as the amount of overlap, giving an estimated count of needed units. Avoid the common error of purchasing a very high-powered radio to cover multiple floors which typically causes good-but-unusable throughput along its edge.
So how do we control those variables? Enter: antenna gain and mounting height. Devices mounted on the ceiling radiates outwards (as a sort of donut) instead of upwards into thin air. So by tweaking these parameters, you can customize the coverage pattern to match your specific room configuration. It even figures out the physics for you, no need to remember the free-space path loss equations. All you have to know is that throwing hardware around is better than just cranking up the power knob. There’s no such thing as strong signal everywhere; there’s only good signal where you need it.
You should of known this earlier. It’s worth taking the time to plan out your network. You’ll end up with something that is more reliable different than just whatever happens to be on a box diagram. Get out there and walk around the room and mark down where everything has to go; the numbers should help drive the decisions of where things actualy fit. When you stop trying to fight against physics and work with it, that ghost of pixels past will fade away.