Solar Sensor Charge Sufficiency Calculator
Check whether a small solar panel can replace each day's active, sleep, and radio-report energy after charger losses, seasonal sun, shade, and usable battery limits.
Live energy snapshot
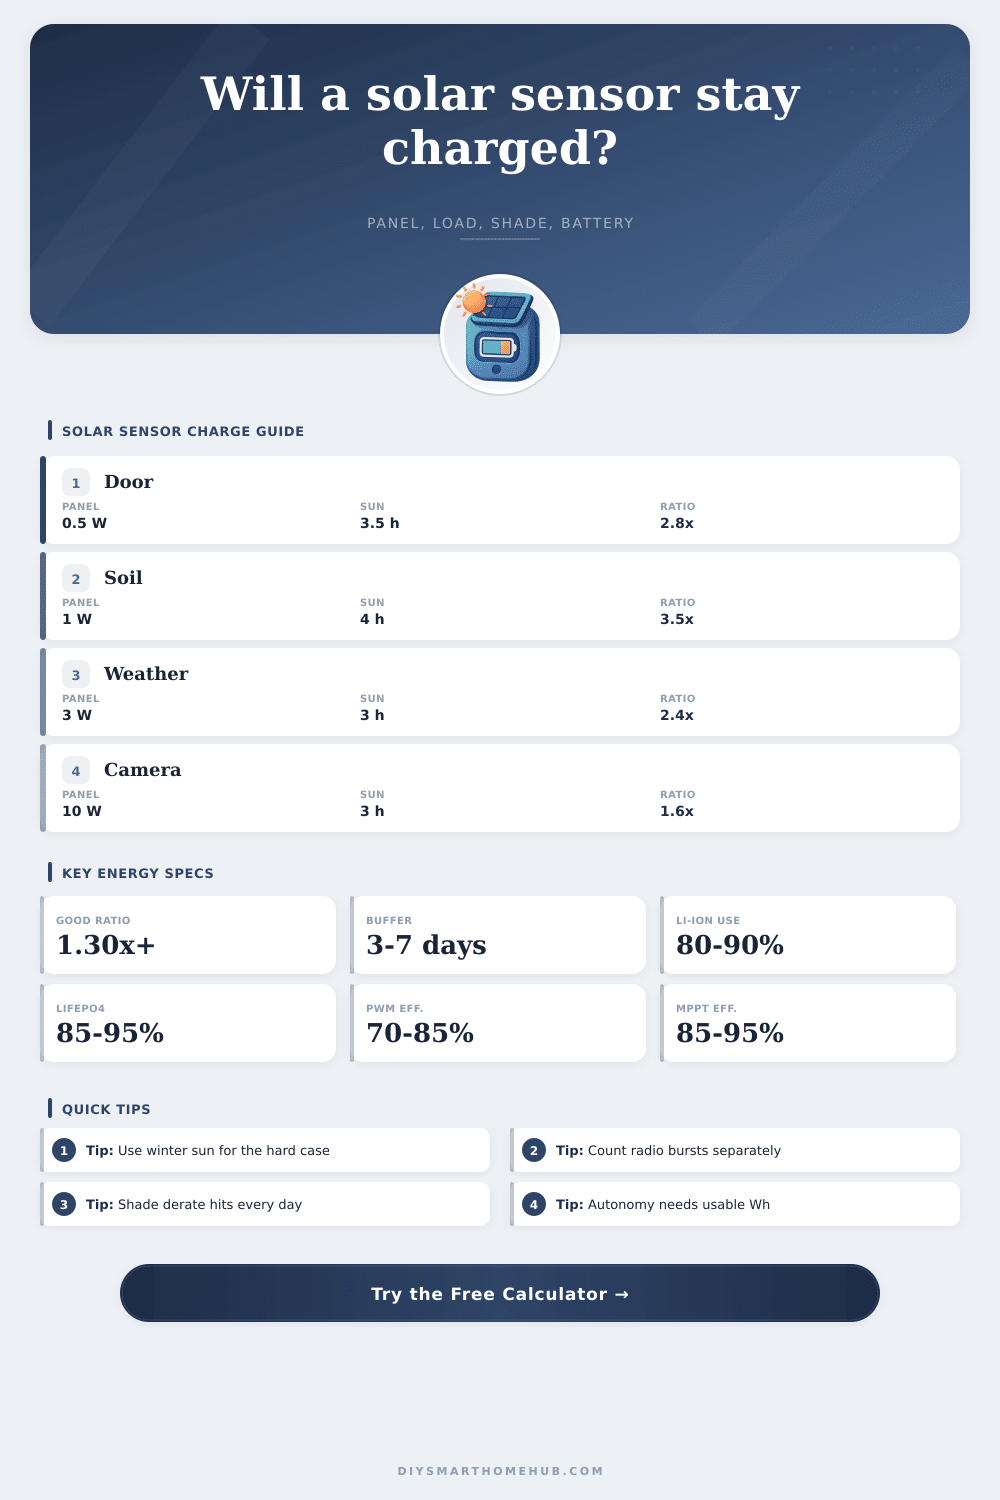
A ratio above 1.30x usually leaves a practical charging margin for small outdoor sensors.
Charge sufficiency result
| Sensor type | Typical daily load | Panel range | Battery reserve | Planning note |
|---|---|---|---|---|
| Contact or leak sensor | 0.002-0.03 Wh/day | 0.3-1 W | 3-10 days | Sleep current usually dominates when events are rare. |
| Soil or tank sensor | 0.02-0.12 Wh/day | 0.5-2 W | 5-14 days | Hourly sampling and a few reports are easy for a small panel. |
| Weather station | 0.1-0.8 Wh/day | 2-6 W | 5-10 days | Wind, rain, display, or higher report rates push load upward. |
| Parking or gate node | 0.1-1.2 Wh/day | 2-8 W | 3-7 days | Event bursts and shaded mounting locations matter. |
| Event camera sensor | 2-10 Wh/day | 8-30 W | 2-5 days | Image capture and WiFi upload require a larger energy budget. |
| Calculation | Formula | Inputs | Result use |
|---|---|---|---|
| Raw daily solar Wh | Panel W x sun-hours x efficiency | Panel rating, peak sun hours, charge path efficiency | Base harvest before shade and weather derate. |
| Derated solar Wh | Raw solar Wh x shade factor x weather factor | Seasonal shade derate and weather/soiling derate | Available daily charge energy for the sensor battery. |
| Active energy | V x mA/1000 x seconds x events / 3600 | Awake current, active duration, active events | Sampling and processing energy each day. |
| Sleep energy | V x microamps/1000000 x sleep seconds / 3600 | Sleep current minus active/report time | Background energy across the rest of the day. |
| Report energy | V x mA/1000 x seconds x reports / 3600 | Transmit current, burst duration, reports per day | Radio or modem energy each day. |
| Autonomy | Battery Wh x usable % / daily load Wh | Battery voltage, mAh, usable capacity, load | No-sun runtime estimate. |
| Charge ratio | Derated solar Wh / sensor daily Wh | Final harvest and final load | Core sufficiency score. |
| Battery or radio choice | Planning value | Solar sizing effect | Field note |
|---|---|---|---|
| Li-ion single cell | 3.6-3.7 V nominal | Wh = Ah x 3.7 x usable fraction | Good energy density, but cold weather reduces usable reserve. |
| LiFePO4 single cell | 3.2 V nominal | Needs slightly more Ah for the same Wh | Often better for heat and longer cycle life outdoors. |
| Zigbee or Thread burst | 20-40 mA for tens of ms | Usually minor unless reports are frequent | Sleep current and wake time often dominate daily Wh. |
| WiFi burst | 80-250 mA for seconds | Can exceed the sensor load budget quickly | Batch reports or reduce connect retries in weak signal areas. |
| LoRa or sub-GHz burst | 30-120 mA for short packets | Low report count keeps panel size small | Link margin can be high without the WiFi association cost. |
So you set up a smart sensor on the back fence. Three weeks later, everything’s fine! Then one day in October the sun angle shifts; suddenly the dashboard lights up with offline node every morning. Your hardware didn’t fail. Your energy budget failed. You sized solar sensors for summer, the day of max panel output, but you forgot about winter, when harvest decrease while load doesn’t change.
The calculator above do the math: can your exact configuration survive that seasonal dip? Here’s why: Small IoT device are finicky. Most of the time they’re drawing nearly nothing because they sit there sleeping, but then they go crazy whenever they transmit on radio. If you look at average current, you might guess a small panel could be enough. However, averages is misleading because peak demand is greater then the daily harvest.
How to Plan Your Solar Power Needs
The question is how many watt-hours do you capture vs. How many watt-hours do you consume? That’s what the charge ratio is about. In general, a ratio greater than 1.3 are considered safe, since it includes some wiggle room for cloudy days and dirty panels.
First: know your local peak sun hours. And then look at your panel’s rated power. Look at the worst case month, not its summer average. In areas where there is deep winter shadows or really cloudy days, you may find your effective sun hours has dropped down into the two- or three-per-day range.
The calculator automatically includes weather and shade derates, which are important as those losses add up. Weather loss of 10%, plus shade of 30% translates into losing almost 40% of what you thought was your theoretical harvest before it even gets on the battery. That can be brutal and many early design don’t account for this.
On the load side, split up what your sensors do into sleep current, active sampling, and radio reporting current. Typically, the radio burst are the energy hog. An hour of sensor reading might be less than a few hundred milliseconds of Wi-Fi or LoRa transmission. How frequently does it report? Once an hour means 24 bursts per day. Multiply that number by its current draw and how long it lasts to find the true daily consumption. This tool will handle all the multiplication for you, no need to worry about converting milliamps to watt-hours yourself.
The other side of that coin is battery life. Having a good charge ratio doesn’t help much unless you have sufficient stored juice to get you through a series of gloomy days. It’s not good to drain lithium-ion batteries all the way down, their usable capacity is typically about 85%, and it may be even lower with standard lithium. The calculator use this usable percentage to give you an accurate idea of what days you’ll have freedom. Three days? Okay, well could of gone buy a big battery! (Or reduce your load.)
You might fail to account for charge controller efficiency. If you buy a cheap PWM controller, it may waste 15% of the energy it receive as heat. You can get an MPPT controller which is more efficient but costs more. That additional expense may never “pay” in terms of saved panel real estate if you’re using really tiny sensors. Buy whatever kind you have and just let the efficiency number run with it.
If you think your panels will be in direct sun all year long, remember that leaves fall off trees. They grow back. Snow falls. It melts. Dust collects. Design for the dirty version of where you’ll install things, not the perfect version.
In short: Load vs. Harvest vs. This is about storage. Solar sensor design is a dance. There is no way to tweak things so that you have more juice if you don’t get enough. The only way to shift that equation are to change the inputs. Add more battery, decrease radio frequency, increase panel size.
That table on the page gives you the reference for common sensors. A door contact is different from an event camera in terms of its energy requirements. Take that as a standard to check your math. Something’s amiss with your sleep current or duty cycle if it takes 10 watts to power your soil moisture node.
Do your math at the start: No midwinter troubleshooting trip required. Know ahead of time if a fence post spot is workable, or if it’ll keel over on Day One of the first big snow. Don’t just focus on making it work now, make sure it keeps working after the light fades and demand doesn’t. Size for survival; the sunny days will take care of themselves.