Smart Home Reliability Uptime Calculator
Estimate smart home availability from internet, router, hub, Wi-Fi, protocol mesh, device uptime, parallel redundancy, and UPS runtime for a realistic annual downtime view.
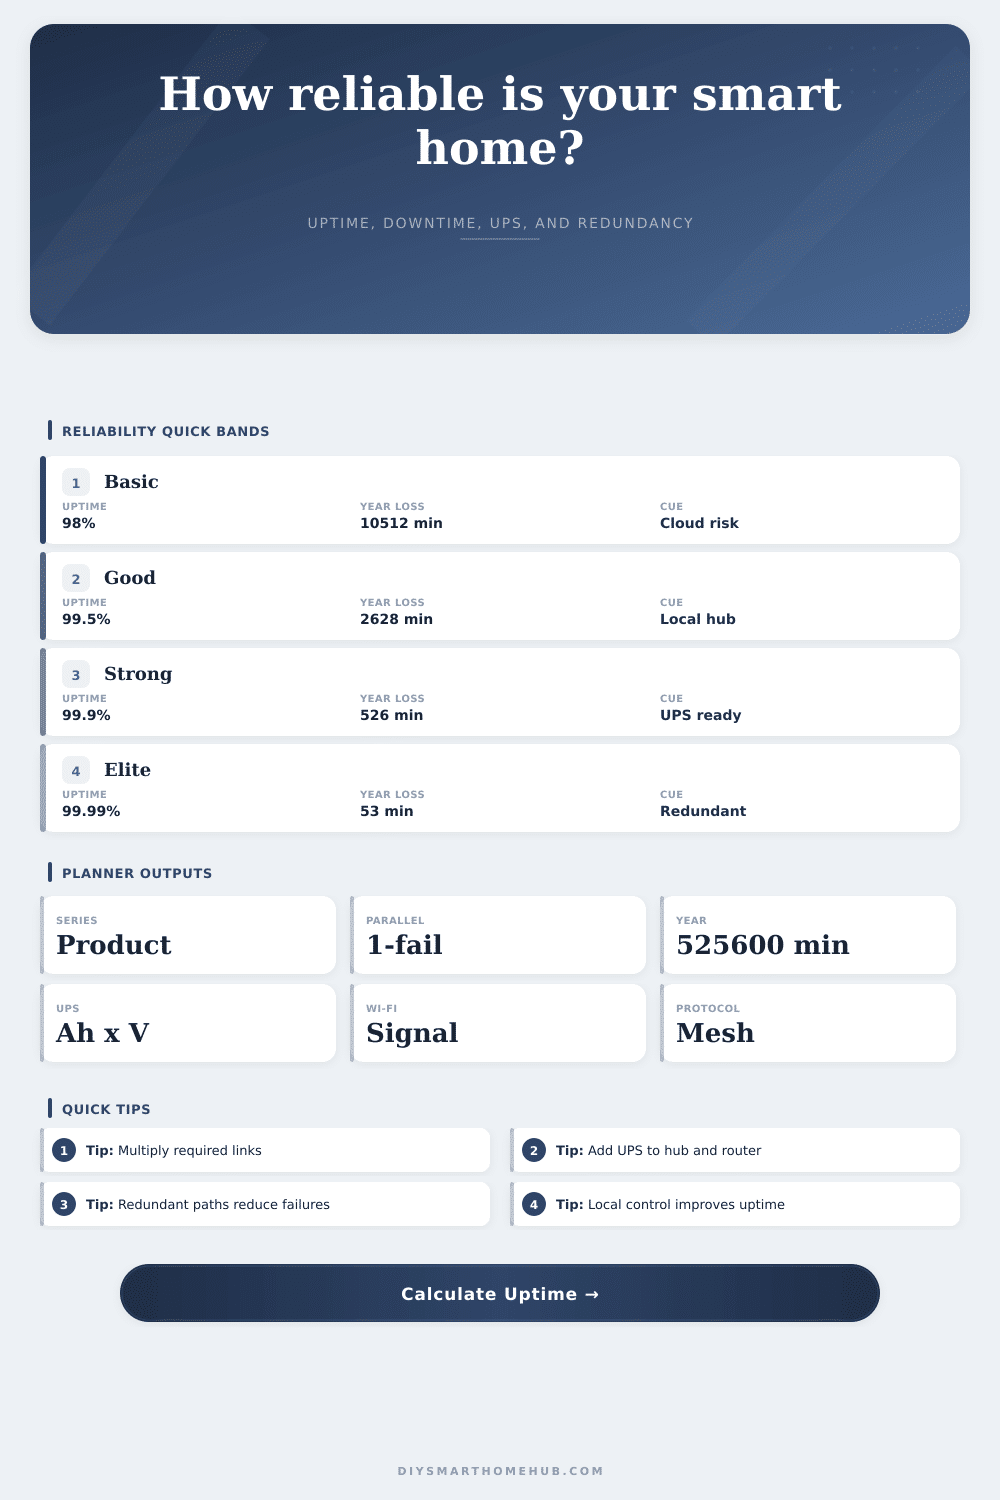
Required components multiply together, including internet, router, hub, protocol, and device layers.
Redundant paths use one minus the product of failure probabilities.
Availability loss multiplied by minutes in a non-leap year.
Battery amp-hours times voltage and efficiency, divided by protected watt load.
| Wi-Fi condition | Planning uptime | Typical cause | Calculator use |
|---|---|---|---|
| Strong wired-backhaul AP | 99.7% to 99.95% | Stable AP, good RSSI, low retries | Use for mains-powered automations near a managed AP. |
| Good mesh node | 99.2% to 99.7% | Mesh hop but strong signal | Use for rooms with steady signal and moderate airtime. |
| Congested 2.4 GHz | 97.5% to 99.0% | Neighbor overlap, retries, IoT crowding | Use for apartments or many Wi-Fi plugs and bulbs. |
| Edge signal device | 94% to 98% | Low RSSI, sleep wake misses, roaming | Use for outdoor sensors, garages, and far rooms. |
| Dual AP coverage | Parallel | Second usable path if one AP fails | Enter primary Wi-Fi plus second AP uptime as redundancy. |
| Protocol layer | Planning range | Reliability pattern | Best calculator input |
|---|---|---|---|
| Wired Ethernet | 99.8% to 99.99% | Low interference, power dependent | Use for hubs, cameras, bridges, and PoE gear. |
| Zigbee mesh | 99.0% to 99.8% | Improves with powered routers | Use higher values when repeaters are dense and stable. |
| Z-Wave mesh | 99.1% to 99.85% | Sub-GHz mesh with route healing | Use for locks, sensors, switches, and security scenes. |
| Thread mesh | 99.2% to 99.9% | Border router plus local IPv6 mesh | Use redundant border routers as parallel hub or path input. |
| Cloud Wi-Fi device | 96% to 99.5% | Needs Wi-Fi, internet, vendor cloud | Set cloud dependency to required for full-chain uptime. |
| BLE direct | 90% to 98% | Range, phone presence, gateway limits | Use for presence or accessories with nearby receivers only. |
Series chain examples
| Automation type | Required links | Typical availability | Interpretation |
|---|---|---|---|
| Cloud voice light | Internet + router + Wi-Fi + cloud + bulb | 96% to 99% | Many required links make small losses stack quickly. |
| Local motion light | Hub + protocol + sensor + switch | 98.5% to 99.8% | No internet dependency improves routine automation uptime. |
| Camera alert | Router + Wi-Fi + camera + storage | 97% to 99.5% | Wireless quality and storage path often dominate. |
| Critical leak shutoff | Hub + protocol + sensor + valve | 98% to 99.9% | Use redundant sensors and protected power for stronger uptime. |
Redundancy examples
| Redundant layer | Formula | Example result | Use case |
|---|---|---|---|
| Dual WAN 99% + 98% | 1 - .01 x .02 | 99.98% | Cloud access during ISP outage. |
| Two 99% sensors | 1 - .01 x .01 | 99.99% | Any one sensor can trigger a scene. |
| Router pair 99.5% + 99% | 1 - .005 x .01 | 99.995% | Gateway failover or warm spare. |
| No backup path | Primary only | Same as input | Series availability uses the single link. |
The chances are that if you have a connected home, you don’t spend much time thinking about your home internet connection… until you’re running late for work and your smart lock decide to go on strike. There’s no greater reminder that convenience comes at a cost. And the cost is the occasional panicked moment when you realize that your connected home might be just an illusion: it “works” most of the time, so you assume it will always work.
But that’s not true. Reliability isn’t binary. It’s based off chance. Every dependency increase the risk of failure. In other words, the more links there are in your system, the more vulnerable the entire setup become.
Why Your Smart Home Breaks
Our calculator models this as a chain of dependencies, with each one increasing likelihood of failure. Because your automation depends on your hub, which depends on your router, which depends on your cloud service, those probabilities stack up and multiply. The math sucks. The tiny decrease in availability compound into hours worth of downtime per year.
Everyone overestimates how stable their wifi is. Your wifi compete with a dozen other wifi networks in a crowded apartment building. Use the reference table on the page to guess how reliable your network will be based off your environment. Perhaps you’re on the edge of the routers’ reach and therefore only have ninety-four percent reliability. Sounds great until you realize that translates into almost half an hour of disrupted service per month.
The trick is mostly understanding what is actualy being measured. Does the light turn on? Yes. But does it turn on when I think it should? And can it do so reliably for an entire year?
But the actual weakness in any setup are power. When the storm takes out a router/hub, the whole ecosystem go dark. That’s why those UPS input ports exist. Based off the wattage draw of your hub and modem, you know how long the batteries will continue to juice them up. And then there’s the math: if your typical outage is forty minutes but your UPS only protects for twenty, well, your smart home really isn’t online half the time.
This is what folks miss. They spend a lot of money on fancy sensors but not so much on the UPS that keep the brains of their house humming.
The difference with redundancy? It’s all about redundancy. Your ISP can drop out and you’re hosed if they’re your sole link to the Internet. With redundant backups (e.g., a cell data backup), however, the calculator consider those two routes together. Both have to fail for the system to fail. That massively decreases your chances of losing everything.
There’s a reason that works. You’re unlikely to see an independent failure. Adding another route, such as another access point or a backup WAN connection, help prevent failure. This transforms a weak network with a single point of failure into a bulletproof one.
Your starting point of reliability is based on protocol selection. Wireless will always be less reliable than wired. Mesh protocols like Zigbee and Z-Wave are fairly robust if there are enough powered devices to repeat signals. However, they require the coordinator to remain available. This is where Thread improves upon existing mesh tech in Matter. However, it too requires an edge router.
Strive for making everything as local as possible. Removing the cloud from the main process remove one very large variable. Remote access and voice assistants are nice-to-haves. Climate control, lights and locks is must-haves.
No system is perfect. Even if you have an elite system with dual internet connections, redundant power sources, and wired backhaul, it’s going to go down sometimes. But that’s the point, how big it is make all the difference. A simple cloud-based solution can lose thousands of minutes of functionality each year. A top local-first solution loses less than an hour.
The calculator lets you visualize that disparity and it challenges you to identify the weaknesses in your particular setup. The way I see it, you don’t have to be a network engineer to increase your uptime. Just know where things fail. Protect core components with a UPS. Whenever practical, move automations to local processing. Only add redundancy where it makes the biggest difference (e.g., your main router or critical security sensors). Everything else? Just fill in the numbers.
When you realize that each additional dependency decreases overall reliability, you begin making smarter decisions. No longer are you chasing every new smart gadget. Instead you’re focused on the infrastructure that keep the ones you already have working. Lights stay on. Locks stay secure. Panic goes away.