Reverse Osmosis Waste Ratio Calculator
Estimate RO permeate, drain-water ratio, recovery percentage, corrected membrane output, tank drawdown, and total feed and waste gallons from pressure and temperature.
Detailed RO waste breakdown
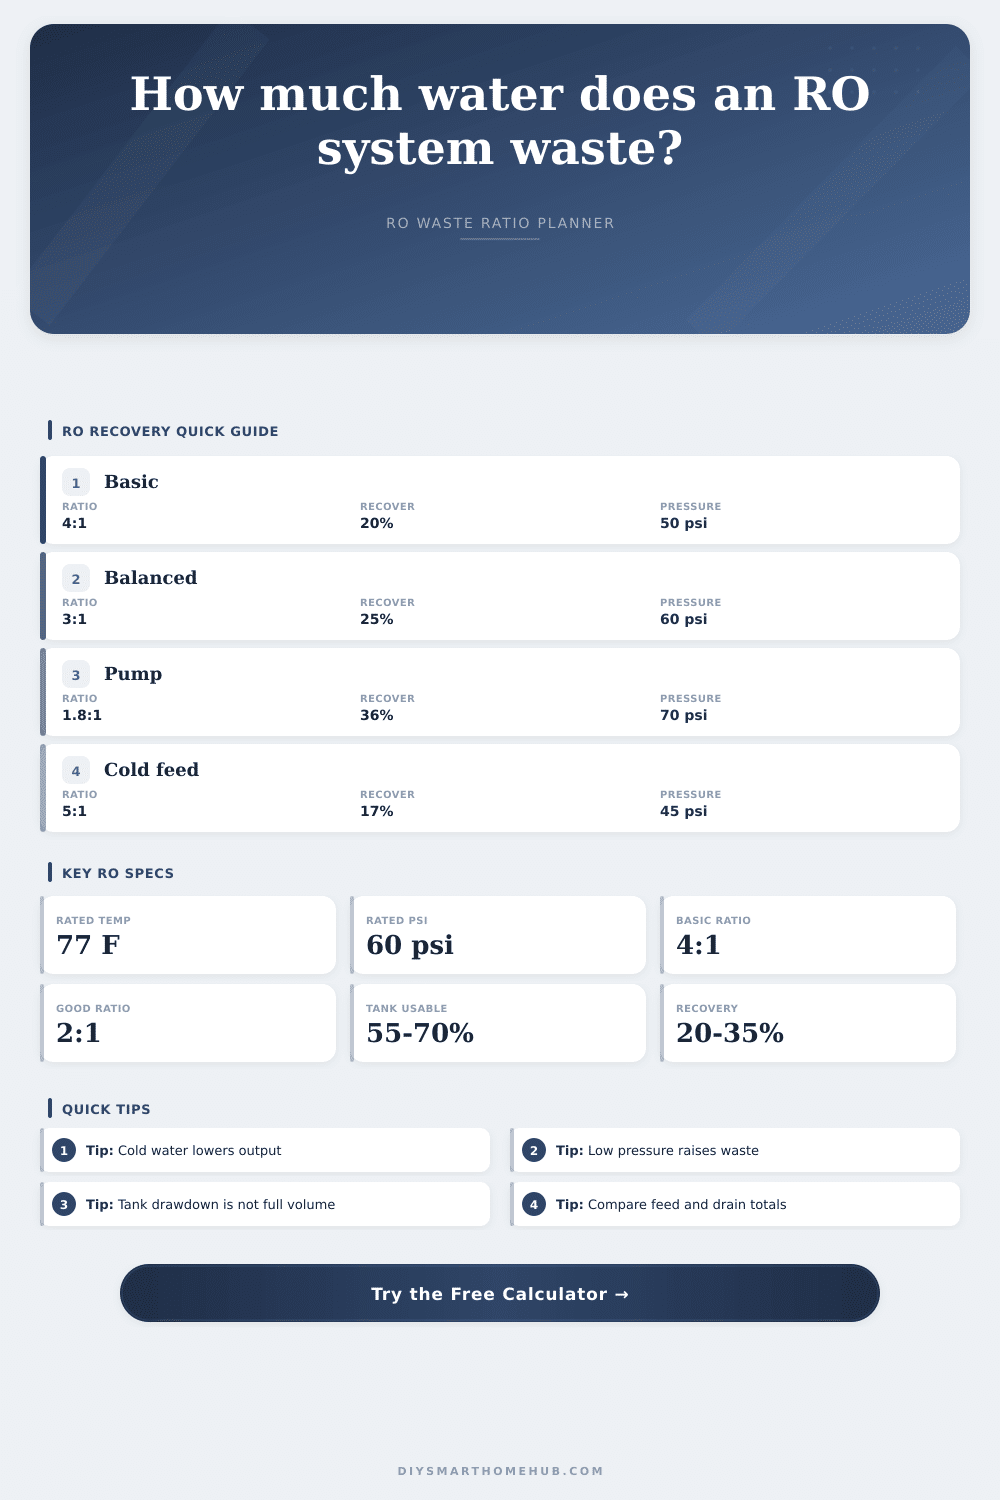
| RO operating style | Typical drain ratio | Recovery percent | What it means for feed water |
|---|---|---|---|
| Basic under-sink RO | 4.0:1 to 5.0:1 | 17% to 20% | About 5 to 6 total feed gallons for each gallon of permeate |
| Balanced residential restrictor | 3.0:1 | 25% | About 4 total feed gallons for each gallon of permeate |
| Booster-pump residential RO | 2.2:1 to 2.6:1 | 28% to 31% | Higher pressure improves production and lowers drain flow |
| Permeate-pump assisted RO | 1.6:1 to 2.2:1 | 31% to 38% | Lower tank backpressure can reduce waste during tank filling |
| Tuned high-recovery setup | 1.2:1 to 1.8:1 | 36% to 45% | Usually needs adequate pressure, good pretreatment, and correct restrictor sizing |
| Condition | Low case | Balanced case | High-output case |
|---|---|---|---|
| Feed pressure | 40 psi, slow output | 60 psi, rated basis | 80 psi, faster output |
| Water temperature | 50°F, about 0.55x | 77°F, 1.00x | 85°F, about 1.27x |
| Tank usability | 45% drawdown | 60% to 70% | 75% with good precharge |
| Daily run time | 1 to 2 hours | 3 to 6 hours | 12 to 24 hours |
| Scenario | Membrane and pressure | Likely daily permeate | Expected waste behavior |
|---|---|---|---|
| Compact under-sink system | 50 GPD at 55 psi | 6 to 10 gallons | Often near 4:1 unless pressure is strong |
| Family drinking-water RO | 75 GPD at 60 psi | 10 to 18 gallons | Balanced restrictor often lands near 3:1 |
| Cold winter feed | 75 GPD at 45 psi | 3 to 8 gallons | Cold temperature and low pressure both increase drain ratio |
| Booster pump system | 75 GPD at 80 psi | 15 to 25 gallons | Better pressure can support lower waste ratios |
| High-output membrane | 100 GPD at 70 psi | 20 to 35 gallons | Waste depends mostly on restrictor and tank backpressure |
Pressure limited
Low feed pressure reduces corrected membrane GPD and usually raises the practical drain ratio because permeate is made more slowly.
Temperature limited
Cold feed water can cut membrane output sharply. The calculator uses a temperature correction against the 77°F rating point.
Tank limited
Pressure tanks do not deliver their full nominal volume. Usable percent converts tank size into realistic drawdown gallons.
Reverse Osmosis systems provides clean water for drinking, but the drain line tells another tale. What appears to be going down the drain are most of what goes through your system. For every single gallon of pure water you collect, four gallons is going down the drain. At first glance, that’s terrible.
But with calculator above, you can get a clear picture of what happens in your pipes and put those vague feelings of wastefulness into real numbers you can work with. Three primary factors affect the math: tank dynamics, temperature and pressure.
Understanding Reverse Osmosis Water Waste
Home membranes is typically rated at 60 lbs/square inch of pressure and a temperature of 77F. But no one’s home water meet ideal lab conditions. Efficiency drops most with water temperature. Thicker cold water isn’t as easy to force through membrane pores. In the winter when your feed water temp is only fifty degrees, it may be producing under half its labeled capacity. The calculator include a correction factor so you can see true output versus the overly-optimistic claims on labels.
The same goes for pressure. In order for the partially permeable membrane to expel water against pressure of dissolved salts, there must be enough pressure pushing it through the membrane. If you don’t have adequate feed pressure, then your membrane isn’t going to make much permeate. But the drain line’s restrictor continues to push water out steadily. So when production slow and drain flow remains consistent, the waste ratio soars. That’s where most folks gets confused. They fault the membrane, but often it’s simply a matter of insufficient driving pressure.
This is laid out neatly on the page and explained very well with a reference table which compares various set-ups. For example, an under-sink system may use four gallons of water to save one. A simple booster pump can greatly reduce that number, down as low as two to one. And it’s typically only a couple of extra dollars spent in electric versus a massive reduction in wasted water. In other words, it’s a question of dollars in (electric) or dollars out (water), and the tool helps you balance that math.
The other complicating factor is tank size. Four gallon tanks are not four gallons of water. They are four gallons of air and water. Typically, only about 60-70% is usable because the rest are a compressed air cushion. Since we don’t want you to overestimate how much you can get from your tanks, the calculator assume that usable percentage when calculating your daily supply. So while you may believe you have four gallons of reserve, it’s possible that all you really have access to is two and a half gallons before your system must be refilled. That could make a big difference in planning for use, particularly if you have limited production time each day.
Many people at home is tempted to tweak the flow restrictor to try to cut down on water usage. Don’t do it! The restrictor keeps the right amount of pressure on both sides of the membrane (the drain side, and the permeate side). If you remove it or replace with a smaller one, you’ll put too much salt into the concentrated side of the membrane and shorten your filter’s life.
These numbers stay realistic by using standard recovery profiles; the calculator assume you’re running your system within safe limits for longest membrane life. For example, the worst case involve low pressure and cold winter feed water. You produce less water per hour because the drain keeps flowing, which means it takes more time to fill the tank; this lead to a lower total volume of permeate and a worse waste ratio. Higher pressure + warmer water = more productive (naturaly better ratio).
The tool lets you enter in your own parameters and get an idea of how you’re doing. Knowing this puts things into perspective when looking at the drain line. Sure, it’s waste, but that is not all it is. That is the exhaust to the purification process. That is what takes the impurities and concentrated salt away. Turn off the exhaust and the system fail.
You don’t want any waste, but you do want to manage it efficienty. Parameters like pressure influence this, and other factors like temperature impact it as well. Minimize the drain but not at the expense of membrane life or water quality. Look at those numbers and see if you’re running an efficient system or whether there may be a simple upgrade that could of helped. Clean water has a cost, but knowing that cost allows you to spend it wisely.