Mold Remediation Drying Time Calculator
Estimate drying time from affected area, material moisture factor, pints to remove, derated dehumidifier output, air mover ACH, target moisture, containment volume, and negative air cycles.
| Step | Formula | Result | Unit |
|---|---|---|---|
| Wet volume | area x depth | 0 | cu ft |
| Material pints | volume x factor | 0 | pints |
| Meter range | start - target | 0 | points |
| Adjusted pints | pints x meter | 0 | pints |
| Step | Formula | Result | Unit |
|---|---|---|---|
| Derated dehu | rated x temp x RH | 0 | pt/day |
| Drying time | pints / dehu | 0 | hours |
| Air mover ACH | CFM x 60 / volume | 0 | ACH |
| Neg air cycles | CFM x 60 / volume | 0 | cycles/hr |
| Material | Factor | Typical depth | Drying note |
|---|---|---|---|
| Painted concrete | 0.30-0.40 | 0.25-1 in | Slow release |
| Drywall face | 0.40-0.50 | 0.25-0.5 in | Meter check |
| Gypsum assembly | 0.50-0.65 | 0.5-0.75 in | Hidden paper |
| Framing lumber | 0.65-0.80 | 1.5-3.5 in | Long tail |
| Carpet and pad | 0.75-0.95 | 0.5-1 in | High airflow |
| Porous insulation | 0.95-1.15 | 2-6 in | Often removed |
| Room temp | Temp factor | Effect | Use case |
|---|---|---|---|
| 45-50°F | 0.45 | Severe derate | Cold basement |
| 51-60°F | 0.65 | Large derate | Crawlspace |
| 61-70°F | 0.85 | Moderate | Cool room |
| 71-80°F | 1.00 | Rated range | Normal room |
| 81-90°F | 1.08 | Improved | Warm drying |
| Surface condition | ACH target | Drying effect | Watch item |
|---|---|---|---|
| Light dampness | 3-5 | Gentle | Dead spots |
| Drywall drying | 5-8 | Moderate | Cavity air |
| Carpet or pad | 6-10 | High | Lift edges |
| Framing lumber | 8-12 | Focused | Surface temp |
| Dense masonry | 4-7 | Steady | Long tail |
| Containment goal | Cycles/hr | Airflow clue | Watch item |
|---|---|---|---|
| Small sealed zone | 4-6 | Stable draw | Door flap |
| Normal work zone | 6-8 | Good exchange | Filter load |
| Dusty removal | 8-12 | Higher flow | Pressure loss |
| Large containment | 4-8 | Multiple units | Leak paths |
| Tight cavity work | 6-10 | Directed | Balance air |
| Scenario | Area | Material | Pints range |
|---|---|---|---|
| Vanity wall | 35 sq ft | Drywall | 8-18 pt |
| Small room | 120 sq ft | Drywall | 25-55 pt |
| Carpet zone | 180 sq ft | Carpet | 65-130 pt |
| Basement slab | 300 sq ft | Concrete | 45-110 pt |
| Framing bay | 240 sq ft | Lumber | 90-190 pt |
| Output | Formula | Unit | Meaning |
|---|---|---|---|
| Wet volume | area x depth | cu ft | Material volume |
| Pints load | volume x factor | pints | Water to remove |
| Derated output | rated x factors | pt/day | Real capacity |
| Drying time | load / output | hours | Runtime estimate |
| Negative cycles | CFM x 60 / volume | 1/hr | Air exchange |
Everyone thinks the worst thing about mold remediation is ripping out drywall, or cleaning spores from walls. Nope. The worst thing is waiting for building to dry.
Moisture can be very stubborn in a wall cavity, yet most folks don’t realize it. They figure that when they feel dry on the surface, the job are complete. That’s when another wave of mold typically begins.
How to Dry Walls Correctly
The calculator above accounts for all the tricky physics of equipment efficiency and evaporation rates so that you can spends your time managing air and containing the situation, physically speaking. So what’s the key? What’s the main thing to be aware of?
The first one is density of the material itself. Sealed concrete and solid framing lumber behave very different than porous gypsum board. When the air flows properly, gypsum dumps its moisture out fast. Wood soaks up that moisture like a sponge. And if you approach a wet stud wall as you would a damp concrete floor, guess how far you’ll get.
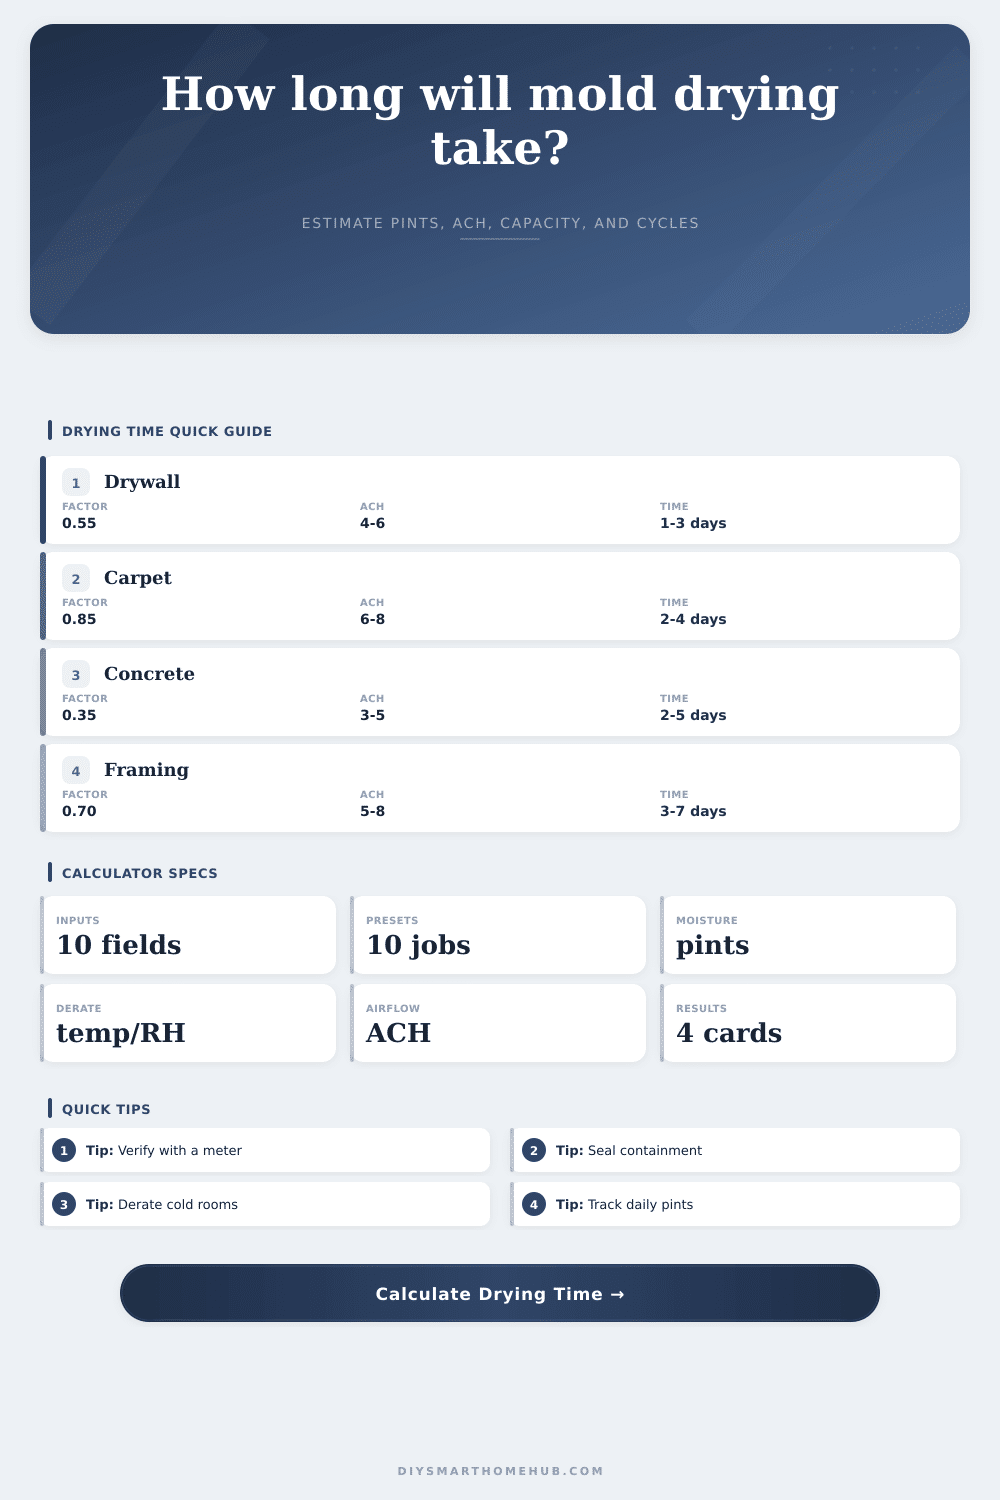
And that’s where the tool comes into play. It understand the various moisture factors for each type of material and applies those accordingly. For a regular gypsum assembly the factor is 0.55; meaning the calculator realizes that drywall has a certain amount of capacity to hold water. That’s not the case for carpet and padding (which have a factor of 0.85). Why? Because the water sits hidden under the pile of carpet. It doesn’t show up until someone smells it.
Dehumidifiers also rely heavily on temperature and relative humidity for how fast they work. The best-case-scenario number listed on your dehumidifier label is its rated capacity. In other words, it’s likely been tested under high humidity and warm temperatures. Rarely are real world conditions like that.
For example, if you’re drying out a crawl space during early spring, the air temp may only be fifty-five degrees. This greatly reduces output of the dehumidifier. You’ll notice the calculator lowers the equipment rating based off the entered temperature and humidity input. That way you don’t plan for a two day dry out when the physics says it’ll really be four. The most common logistic mistake seen in remediation projects is underestimating the derate.
The key to drying is air flow, it’s what makes the whole process work. Have the biggest, baddest dehumidifier out there? If there is no air movement over the wet surfaces, then there’s nothing for the machine to take the moisture out of. A dehumidifier creates surface evaporation via air movers. The dehumidifier pulls the vapor out of the air.
To see if the air is moving fast enough, the tool will calculates how many air changes per hour. Too little airflow leads to stagnant pockets of moisture where mold can regrow within days. Too much airflow with insufficient dehumidification mean just circulating the wet air throughout the room. It’s a balancing act.
Containment zones add a whole other level of complication with negative air pressure. You must exchange the air to contain spores and keep it from becoming saturated. How many times an hour do you want to turn over the air? That’s what the negative air cycle calculation does.
It will tell you if your filtration unit is strong enough to maintain pressure while still allowing space to breathe. This allows you to have some breathing room while still holding a seal on the containment when you create negative air pressure. Too high and you’re wasting energy. Too low and there’s a chance you’ll suck in unfiltered air through cracks, find the sweet spot that keeps you safe without slowing down your drying speed.
Last: Most amateurs don’t do this, and they shouldn’t of rely on their eyes and nose alone. Use a moisture meter to verify that the material is in balance with surroundings.
To be sure that there’s no concealed moisture behind walls or beneath floors, the calculator recommends a buffer to account for hidden moisture in cavities or under flooring. This buffer increases your estimation time. By doing so, you avoid cutting the drying too early; only to come back three weeks later because you didn’t plan for the slow end of drying. Fixing recurrence is more expensive than planning for its prevention.
Drying requires patience as much as power. The calculators tells you how long to wait. The meters tell you when you’re really done. Respect both and you’ll keep the mold away.