Event Log Storage Retention Calculator
Estimate smart home event log storage from events per day, bytes per event, severity filtering, log source mix, compression, index overhead, retention days, and reserve headroom.
Results will appear here.
Short key-value logs from basic sensors, state changes, and simple automation messages.
Common smart home recorder events with source, object, severity, attributes, and context IDs.
Motion clips, object detections, thumbnails references, zones, confidence, and webhook payloads.
Temporary tracing can multiply message count and byte size, so it should be modeled separately.
| Severity retained | Typical kept | Best for | Watch item |
|---|---|---|---|
| All events | 100% | Short debug windows | Fast growth |
| Info and above | 50 to 80% | Normal operations | Noisy integrations |
| Warning and above | 10 to 25% | Health dashboards | Lost detail |
| Error only | 1 to 8% | Alerts and audits | Weak history |
| Stored format | Compression | Index overhead | Note |
|---|---|---|---|
| Plain text gzip | 25 to 45% | 0 to 10% | Archive first |
| SQLite rows | 55 to 90% | 10 to 30% | Local hub |
| Search index | 35 to 70% | 20 to 60% | Fast queries |
| Cluster replica | 35 to 70% | 2x copies | High uptime |
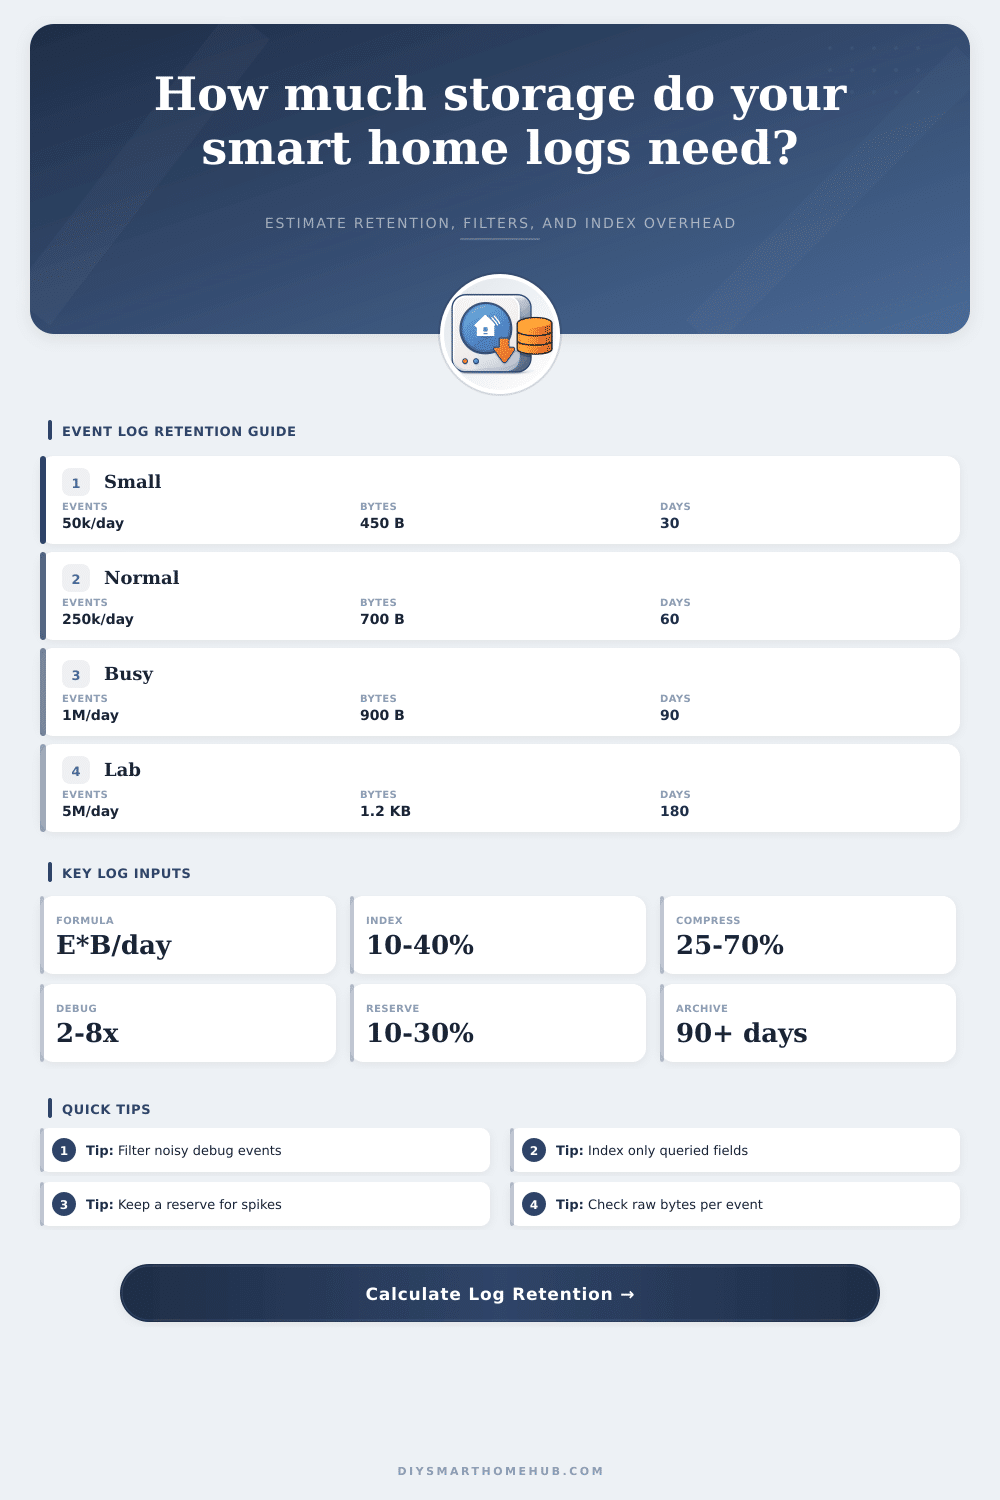
| Event rate | Daily count | 700 B raw | Use case |
|---|---|---|---|
| Low | 50k/day | 33 MB | Small hub |
| Normal | 250k/day | 167 MB | Family home |
| Busy | 1M/day | 668 MB | Telemetry |
| Very busy | 5M/day | 3.3 GB | Lab stack |
| Scenario | Events/day | Retention | Main driver |
|---|---|---|---|
| Starter hub | 50k | 30 days | State history |
| Normal home | 250k | 60 days | Info logs |
| Security audit | 500k | 180 days | Warnings |
| Debug window | 2M | 7 days | Trace data |
All smart homes begin with noble goals but frequently wind down in a disk drive filled with regret. Motion sensors is installed. A camera feed are set up. An energy monitor is hooked up to track power usage. Excitement fill the air during that initial week as every toggle of a light bulb or opening of a door generates a flurry of fresh data. But by month three, trouble begin as automation server rejects new entries because there’s no more room. It’s not always a problem of hardware failure; more commonly it’s a question of not thinking through how fast log files expands.
Event streams constantly fill storage which has limits. And since the calculator above do all the math for you if you input an estimate of how much data you think you’ll be generating per day, there’s no need to go guessing at any compression ratios or coefficients. And while many people think “logging” means dumping some text into a file somewhere, they don’t realize that each line has a payload of data, along with a time stamp, severity level and source ID too. What may appear as simple message on-screen takes up hundreds of bytes in structured JSON form. Multiply this times two-hundred and fifty-thousand events-per-day and suddenly that raw data begins to add up pretty fastly.
How to Save Space on Your Smart Home Logs
The first way to control fast storage growth is filtering. Why should all of those log entries lives on your server forever? When there’s a problem with one of your integrations, debug traces are priceless; at other times they’re just noise. With the tool, you can define severity thresholds and estimate the space savings from discarding the wordy ones. Dropping down to error and warning might cut your volume dramaticly (at the risk of losing the context to troubleshoot less obvious glitches in the future). It’s a tradeoff between capacity and clarity.
The other factor that determines your end result is compression. As a data type, logs is very well-suited to be compressed as they are very repetitive. Depending on how verbose the messages are and what kind of structure they have, you can expect to reduce raw log streams by upwards of 50%. If you’re just looking for ballpark figures, the reference table at the bottom of the page lists average ranges by format so you don’t have to hope for the best case scenario but know roughly what to expect. Compression works better when combined with filtering since fewer useless bits needs to get compressed in the initial step.
And then there’s index overhead… Which also surprises admins. Because you’re not just searching plain text files, but a database or search engine doing the querying on your behalf, those indexes takes up more space. That allows them to quickly return results when you want to find an event, but it costs something. To accommodate the index size needed to actualy use your logs, there’s an input for that in the calculator. Otherwise, you’ll suddenly have no more room. Your data volume increases so the system has to keep pace with that and the queries to deliver performance.
To be clear: I’m not saying logs aren’t worth storing! But understanding how much space they’ll take up is important before you decide where to store them.
Finally there are retention policies: How long do you retain that data online? If you’re simply keeping an eye on things with home automation, maybe 30 days is enough. For detailed investigation in security audits, you may need a much longer window. It’s good practice to have some margin in case there are traffic surges, or if you have to update your firmware, so that the system doesn’t crash. That’s the difference between having everything run smoothly and a system failure that stops your smart home.
So there we are: Event logging is really just an exercise in tradeoffs between capacity and history. How much do you need? As much as it takes to solve problems… But not too much, or it will choke your infrastucture. Find the sweet spot for your situation by setting event rate input, average message size and how efficient you want them compressed. Predictable growth, not reactivity is the name of the game. Knowledge about the source of log volume means no more fear over next month’s disk use; only preparation for it. Preparation changes a potential storage catastrophe to a routine admin task. You should of planned ahead.