CO2 Sensor Count per Room Calculator
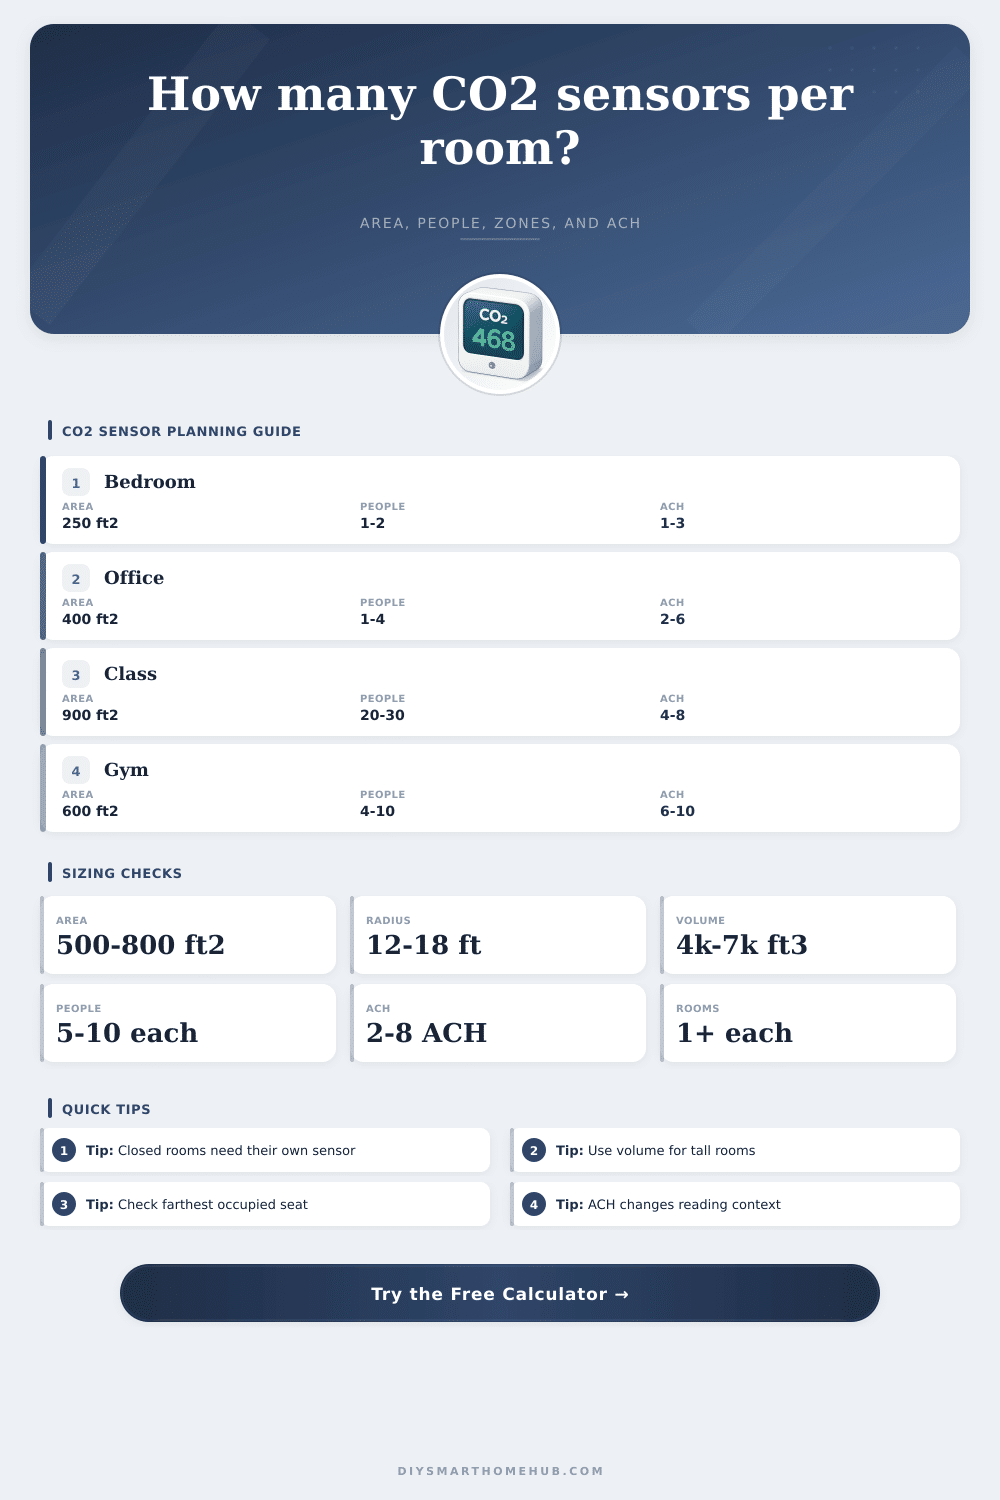
Estimate CO2 monitor quantity for each room by comparing floor area, separate air zones, occupant load, mixed room volume, response distance, room separation, and ventilation context.
This calculator is a planning estimator for room-level CO2 monitoring. Final placement still depends on the sensor listing, local code, HVAC layout, and the purpose of the monitoring system.
| Room name | Use | Length ft | Width ft | Height ft | People | Air zones | ACH | Output |
|---|
Run the calculator to see the recommended sensor count and the constraint that drives each room.
| Room | Area | Area | Zones | People | Volume | Distance | Final | ACH note |
|---|
Sensor profile assumptions
| Profile | Area per sensor | Response radius | Occupant limit |
|---|---|---|---|
| Residential NDIR monitor | 700 ft2 / 65 m2 | 16 ft / 4.9 m | 8 people |
| Office IAQ node | 600 ft2 / 56 m2 | 14 ft / 4.3 m | 6 people |
| Classroom or meeting room | 500 ft2 / 46 m2 | 13 ft / 4.0 m | 5 people |
| Dense activity room | 450 ft2 / 42 m2 | 12 ft / 3.7 m | 4 people |
| Commercial BMS point | 800 ft2 / 74 m2 | 18 ft / 5.5 m | 10 people |
| Conservative retrofit layout | 400 ft2 / 37 m2 | 11 ft / 3.4 m | 4 people |
Calculation checks
| Check | Formula | Purpose | When it drives count |
|---|---|---|---|
| Area | ceil(area / allowed area) | Limits coverage footprint | Large open rooms |
| Air zones | ceil(separate zones) | Prevents one sensor representing divided air | Partially separated rooms |
| Occupancy | ceil(people / people limit) | Captures CO2 source density | Classrooms and meeting rooms |
| Mixing volume | ceil(volume / mixed volume) | Accounts for tall or bulky rooms | High ceilings and large basements |
| Response distance | ceil(L / 2R) x ceil(W / 2R) | Keeps occupied seats near a sensor | Long narrow rooms |
| Room separation | minimum one per closed room | Closed doors block shared readings | Bedrooms and offices |
ACH interpretation
| ACH range | Air-change time | CO2 context | Calculator effect |
|---|---|---|---|
| Under 1.5 ACH | 40+ min | Slow mixing and slow recovery | Reduces volume and radius credit |
| 1.5 to 3 ACH | 20 to 40 min | Typical home room context | Uses normal planning factors |
| 3 to 6 ACH | 10 to 20 min | Better dilution and trend response | Uses normal planning factors |
| Over 6 ACH | Under 10 min | Good dilution, possible short-circuiting | Slightly tightens response-distance credit |
Common room examples
| Room example | Typical driver | Starting count | Review trigger |
|---|---|---|---|
| Small bedroom | Room separation | 1 sensor | Closed door and low ACH |
| Home office | Room separation or people | 1 sensor | Two or more workers |
| Open plan living | Area and response distance | 1 to 2 sensors | Long kitchen-living span |
| Classroom or meeting room | Occupancy | 2+ sensors | Dense seating layout |
| Home gym | Occupancy and generation | 1 to 3 sensors | Active users and high peaks |
| Finished basement | Zones and volume | 2+ sensors | Divided media and guest areas |
After an hour in a closed room you might feel a little woozy. You’re not just tired. Your brain are managing the increased level of carbon dioxide. And most people think it’s as simple as having one sensor somewhere in the corner… but that doesn’t tell the full story.
Air doesn’t mix evenly. It pools. It stagnates, and it flows in current. The exact placement of your device has to account for those currents. It’s not so much about purchasing hardware to get the right amount of sensor for a given space. It’s more about learning how this gas moves through your particular set of walls.
Why Air Sensors Need Careful Placement
The trouble begins when we assume that air is static. When people sleep, they’re breathing out more heavy gas which sinks to the floor. If the office have high ceilings, air might rise depending on temperature of the space.
Plug in your dimensions into the calculator above and let it do the math. Don’t guess where the dead spots in your air are. These might be caused by low beams or tall windows that a single unit can’t cover. Enter your room’s height, width, and length, but then think about what sits between these numbers. On paper, a room could appear small. But with a sitting nook here and a partitioned-off desk area over there, the air in one corner doesn’t tell you anything different than the other.
Then there’s occupancy, the silent driver. When two people works in a small home office, they’re pumping out a continuous stream of carbon dioxide. And with poor ventilation, it can raise those levels fast. Bring twenty students into a classroom and you’ve got a heavy cloud that takes several points to map propery. Not only does it ask for a body count, it estimates the load. If you have a room where you’ll routinely exceed six occupants, chances are you’ll need more than one sensor to realy get an accurate average.
This is one thing that’s easy to forget until it happens: You fall asleep at a meeting, and they blame the stuffy air, except to find the lone sensor had drifted onto a rare spot of fresh intake.
Context: What do these numbers mean? You have Air Changes Per Hour, or ACH, which determines whether a single sensor is enough or not. If you’re ventilating heavily, your carbon dioxide will be diluted quickly, meaning you only need one sensor. On the other hand, if airflow is sluggish (as in, air isn’t changing frequently), then even a smaller room require close watching. The calculator use this to determine how much confidence you should of have in each reading. Recovery is slow after peaks because ACH is low. So you want more eyes on the room, to detect the rise while it still matter to comfort levels.
More sensors are nice, sure. You also need to consider how those sensors is placed in relation to people and vents. Each room has its own ecosystem. A room behind a closed door isn’t going to have the same reading as an open-plan living area. There’s no free-flow of air between the two which means sensor count should reflect this separation. For example, maybe your tiny apartment makes it seem like there’s just one space (kitchen + living). But because a big piece of furnitures or partial wall breaks up the airflow, then we’re talking about separate zones here. If you ignore these physical separations, you run into blind spots. You might know exactly how stuffy the hallway is, but you will miss the buildup in the true workspace.
And then there’s height. “If you have sensors up high on the wall they may not capture your breathing zone at all.” If monitors are hanging up by the ceiling, or at desk level, the tool will help you determine how to adjust. It takes into account mixing, because no actual room is as perfect as an idealized diagram. There is always some piece of furniture in the way, such as a bookshelf or a couch.
At the end of the day, sensor counting is all about cost versus coverage. You don’t want too much noise, but not so little data as to not be able to act on it. Begin by mapping where folks really sit. Next, find out if these locations fall into range of your selected device(s). If not, then add an additional point.
Once you stop thinking of air as uniform, and begin to see it as something that must be herded, it’s easier than it seems. After all, that heaving feeling at the end of the day is merely a signal needing proper attention.