Infiltration Rate Calculator
Estimate natural infiltration from blower door CFM50, house volume, N-factor, wind exposure, stack height, effective leakage area, pressure exponent, and seasonal weather factor.
🏠Enclosure presets
⚙Blower door and natural pressure inputs
Enter a measured blower-door result when you have one. The calculator reports the N-factor ACHnat estimate, the pressure-exponent CFM estimate, and a combined planning value so the assumptions stay visible.
📊Infiltration result
🧱Enclosure spec grid
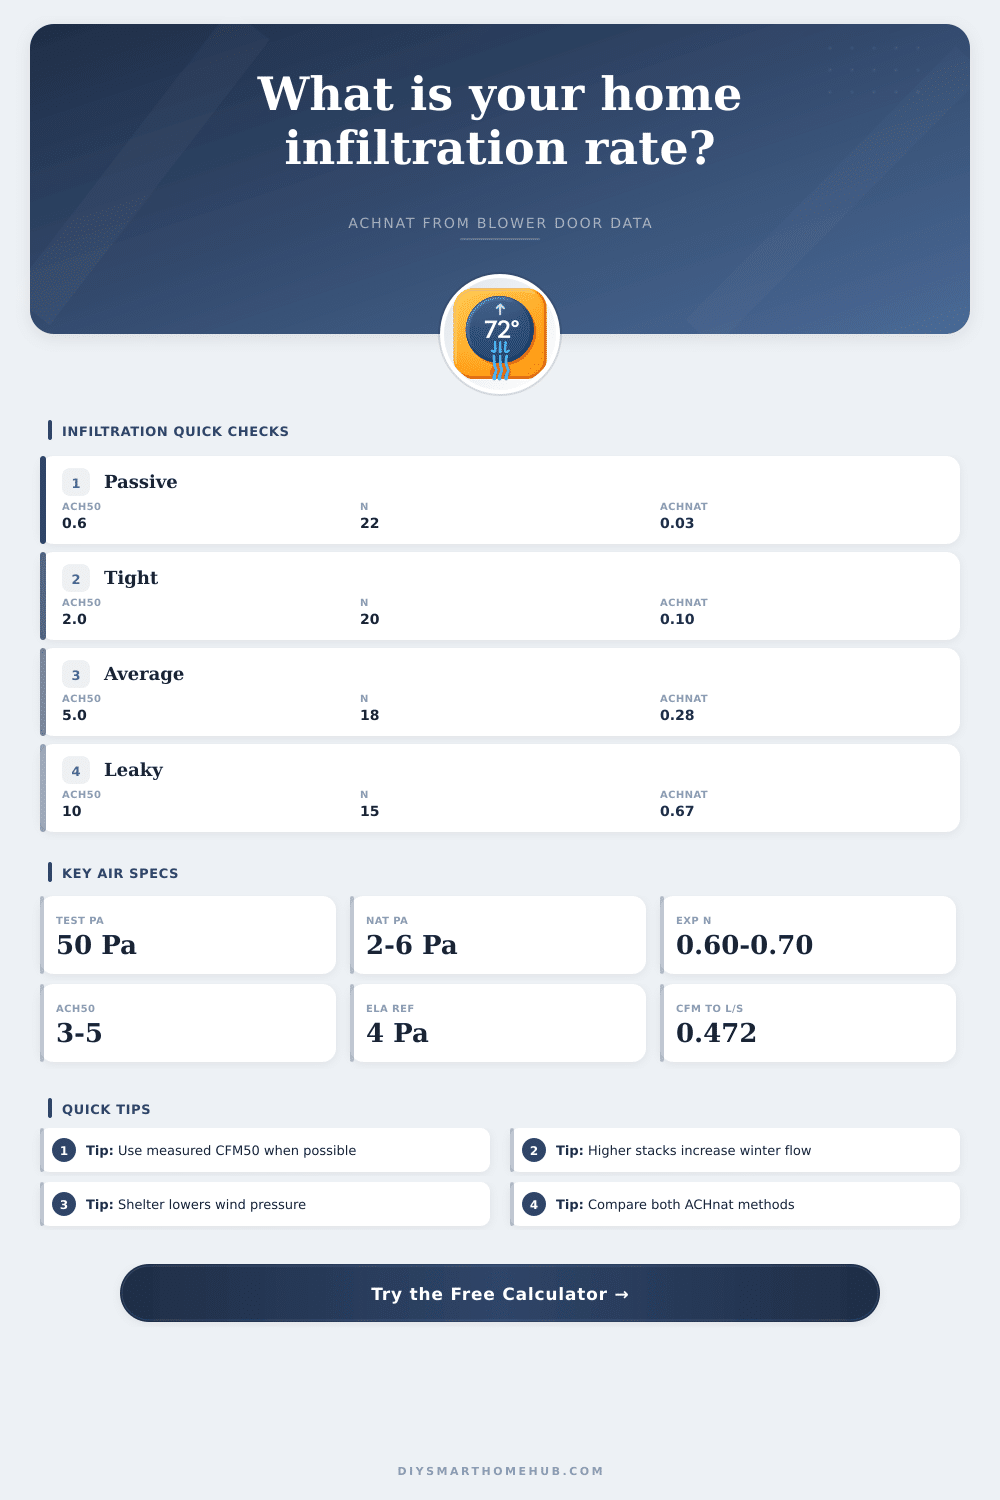
📐ACH50 and ACHnat reference
| Envelope level | ACH50 band | ACHnat guide | Planning note |
|---|
🌬Exposure and weather factors
| Condition | Wind multiplier | Natural Pa | Use case |
|---|
💨Pressure exponent and leakage area
| Leak path type | Exponent | ELA signal | Interpretation |
|---|
🏘Common home examples
| Example | CFM50 | Volume | Likely result |
|---|
💡Calculation tips
CFM50 is repeatable compared with natural airflow. Treat natural infiltration as a modeled estimate that changes with wind, stack effect, and weather.
The N-factor method is quick; the pressure-exponent method shows how stack height, weather, exposure, and leakage behavior push natural CFM up or down.
Large ELA per floor area often points to attic bypasses, rim joists, chases, recessed fixtures, service penetrations, or leaky returns.
Infiltration is uncontrolled and seasonal. Tight homes still need deliberate outdoor air from a balanced or dedicated ventilation path.
That’s why a tight house is less about caulking and weather stripping than about airflow in and out of your walls. Homeowners tend to assume that their house exterior acts like a solid shell; but it function more like a sponge with pressure turned up. While the blower door test provide a snapshot of how much airtightness there is at high pressure, it’s not the full picture. How much natural air leaks in depends on specific shape of the leaks in your home, as well as the winds and difference between indoor and outdoor temperatures. That’s why it’s important to translate CFM50 into a reasonable air change rate for both energy bills and comfort.
Once you enter all of this data about your home into the calculator above, it will do all of the work for you. You won’t even need to guess how the outside environment affect these lab numbers. Most people’s error is to assume the test number is linearly scaled down, that isn’t the case. Airflow behaves as a curve, so small differences in pressure result in much larger volumes of air moving through. This is where the pressure exponent play a role. Typically, homes has a pressure exponent between 0.60, 0.70. If yours is high (closer to 1), then you probably have some big holes like missing outlet boxes; if it’s low (closer to zero) then you likely have lots of little crack surrounding framing members. Either way, understanding this will help you know where to tackle next with the foam/tape.
Understanding How Air Moves in Your Home
The equation is also tricky in terms of wind. Two houses with equal blower door scores might differ greatly in their natural infiltration depending on whether the house sit on an open hillside or in a stand of trees. The wind multiplier corrects for the fact that wind-driven turbulence pushes air into and out of your house on windy days. If you’re on a ridge or live near the coast where pressures are higher, take that into account since the typical suburban assumptions will underestimates what you’re losing. You can use the tool’s ability to tweak variables to show worst-case scenarios instead of simply average conditions.
Another factor that catches homeowners off guard is called stack effect, meaning the warmer air at the top of your home are rising and leaking out, while colder air is being sucked into the house from the bottom. This stack effect is influenced by the winter cold, and it’s greater the taller your house is. So if you have a two-story colonial, it will lose more heat due to this mechanism different than a single-story ranch (all else equal). The calculator calculate the contribution of this based off the stack height, telling the difference between thermal-driven flow and wind-driven flow. How much of your infiltration do you think is driven solely by temperature and gravity?
The effective leakage area is a good check on the audit results: You can think about how much leakage there is (hole size in square inches, at standard pressure), rather than cubic feet per minute. That makes it easier to visualize the problem. High ELA numbers point to certain types of building gaps, such as unsealed recessed lights or poorly insulated attic knee wall. You can compare your calculation of leakage intensity against what’s allowed under codes, or the target of passive house standards, and get a sense of how you’re doing. If you come up with numbers that are typical of the leaky older home category, you’ve got a clear idea of where you start before you spend money insulating things up.
Remember that uncontrolled ventilation is infiltration. Leak-driven ventilation, while tempting, is a bad idea, it’s both inefficient (because infiltrating air carries humidity, too) and dangerous (in summer it leads to heat gain; in winter, it can cause mold). Tight houses need intentional mechanical ventilation, which keeps the air fresh without wasting money. Those numbers we generate here will allow you to properly size such systems so that they deliver enough outdoor air but don’t overheat or overcool your inside air.
And in the end, all of this makes something abstract, the way your house breathes, into something practical: something that you could of do maintenance on. You will not just hope that you eliminated all drafts, but know exactly how much air is going where. Each time you close up a gap, you subtract from that total. Each time you install an ERV, you shift from uncontrolled leakage to controlled exchange. Your goal isn’t no infiltration; your goal is balanced, predictable flow of air that works for you instead of against you. So you measure the gaps first and control the breath afterward.