HVAC Runtime Per Day Calculator
Estimate daily HVAC run hours from equipment capacity, home load estimate, outdoor temperature delta, thermostat setpoint, duty cycle behavior, stage efficiency, envelope quality, and occupancy schedule.
🏠Runtime presets
⚙HVAC runtime inputs
Daily runtime result
The selected load, capacity, thermostat delta, and schedule are ready to calculate.
▦Equipment spec grid
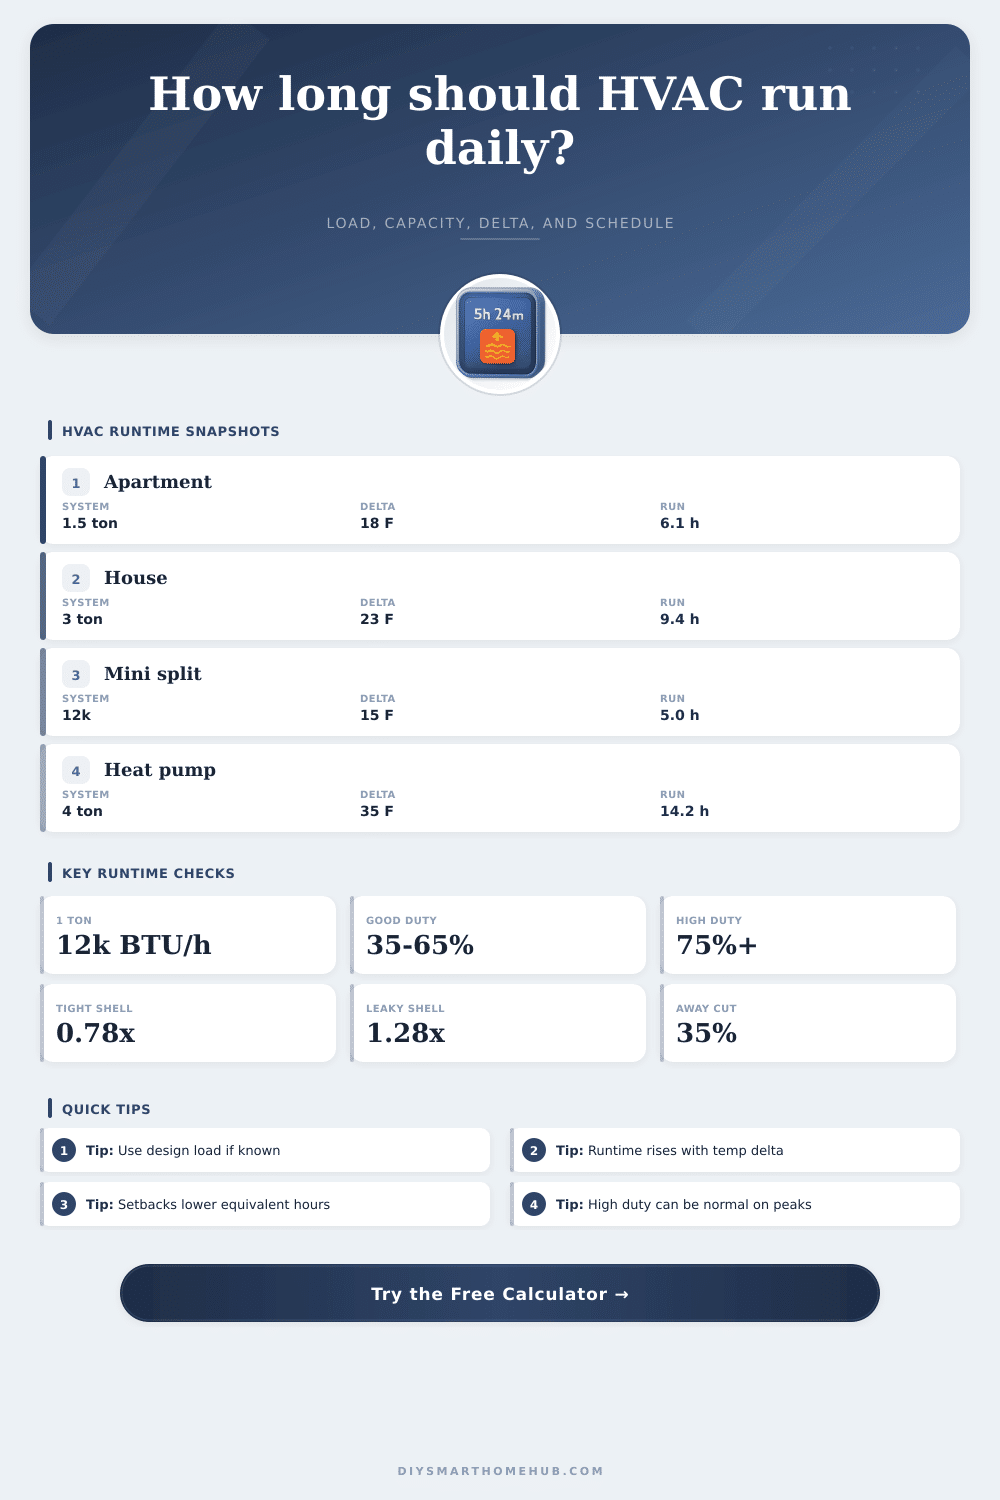
Cooling equipment capacity is often described in tons.
Many systems sit in this band on warm or cold days.
High duty can be expected near design weather.
Air leaks and weak attic insulation lift the load.
📊Reference tables
Runtime reading by average duty cycle
| Duty cycle | Runtime per day | Common reading | What it often means |
|---|---|---|---|
| Under 25% | Under 6 hours | Light load | Mild weather, oversized equipment, or strong setbacks. |
| 25-45% | 6-11 hours | Comfortable | Normal part-day operation for many homes. |
| 45-65% | 11-16 hours | Steady load | Useful long cycles with good humidity or temperature control. |
| 65-85% | 16-20 hours | Heavy load | Near design weather, high gains, or limited capacity margin. |
| Over 85% | Over 20 hours | Near limit | Capacity may be tight if comfort is not maintained. |
Equipment capacity and stage behavior
| Equipment style | Capacity factor | Cycle factor | Best runtime pattern |
|---|---|---|---|
| Single-stage standard | 0.96 | 1.04 | Moderate cycles with thermostat deadband. |
| Two-stage balanced | 1.00 | 0.99 | Longer lower-stage operation when load is modest. |
| Variable-speed inverter | 1.06 | 0.94 | Long low-output cycles with less start loss. |
| Heat pump cold weather | 0.78 | 1.08 | Reduced delivered capacity as outdoor temperature drops. |
| Aging or restricted system | 0.86 | 1.12 | Runtime rises because delivered output is lower. |
Envelope factor guide
| Envelope setting | Load factor | Typical signs | Runtime effect |
|---|---|---|---|
| Excellent air sealing | 0.78x | Newer shell, sealed attic, good windows. | Shorter runtime for the same weather. |
| Good insulation | 0.90x | Updated insulation and moderate leakage. | Below-average load for its size. |
| Average envelope | 1.00x | Typical older home with ordinary leakage. | Baseline runtime estimate. |
| Leaky or weak attic | 1.28x | Drafts, hot ceiling, or large duct losses. | Runtime climbs quickly on peak days. |
| Poor shell or big glass | 1.48x | Weak insulation, high sun, or large glass area. | Capacity margin can disappear. |
Occupancy schedule factors
| Schedule | Comfort hours | Setback hours | Default reduction |
|---|---|---|---|
| Home all day | 24 | 0 | 0% |
| Workday away | 15 | 9 | 30% |
| Smart away mode | 12 | 12 | 45% |
| Night setback | 16 | 8 | 25% |
| Part-time occupancy | 9 | 15 | 50% |
💡Runtime calculation tips
The calculator tells you how many hours a day your HVAC system should operate, which is useful for diagnosing any comfort issues before they escalate into costly repairs. Homeowners don’t typically give much thought to runtime (unless the system isn’t heating/cooling the house sufficiently) but knowing your runtime let you precisely control your living space.
First you plug in your homes cooling load (how much your house needs) compared to the output of your machine (what your machine delivers). Next, it determines how long that will take based off your estimated home load versus the capacity of your equipment. For example, if your machine puts out twenty-four thousand BTU per hour, but your house need thirty thousand, then your machine isn’t keeping pace with demand.
Why HVAC Runtime Matters for Your Home
Then the calculator scales that number depending on the temperature differential between your outside and inside air. How much do the walls need to do? Less if there’s a twenty degree difference vs. More than a forty degree difference. That’s where input comes in… It bases the estimate on todays weather instead of the average.
But it makes a big difference in what kind of envelope your home has. A home with good sealing and tightness will hold its temperature easy. A leaky home (say a leaky attic) will make running HVAC a battle to keep comfortabley. That’s where the multiplier on your estimated load comes in on the calculator. If you are missing insulation or old windows, then that multiplier goes up…meaning the system now has to runs more to get the job done. You say “well I only need 8 hours to run” but what about all the energy lost from cracks? That’s money going out the window! And folks complain about their refrigerant not being right or that thermostat isn’t set right. No, the issue is the structure of house.
Duty cycle: Short cycling is less efficient and less comfortable. Running the system for just 10 minutes isn’t enough time to move much air around, yet it still waste all that energy getting started. The duty cycle tables above shows the relationship between runtimes and duty cycle. Ideally, you have a long, consistent cycle that heats/cool your space thoroughly. It doesn’t need to restart until the space begins losing its heat or coolness. Variable speed inverters assist here because they modulate their output rather than either being fully on or fully off. The calc takes into account such behavior by applying cycle efficiencies and capacity factors. Even though both units might have exact same BTU’s, you’ll notice the difference between a single stage and two-stage system.
Runtime is also impacted by what you’re doing while at home. Wanting to be comfortable all day long means far less comfort when you’re out of the house. When at home, the tool separates your active time for comfort from times you want to set it back. Without internal heat gain from people, computers, and lights, the reduction in loads is very real during away hours. There’s no need to keep that empty room at seventy-two degrees. Lowering the temperature reduces the average runtime for the whole day, so it doesn’t took much comfort away when you’re there. A small tweak makes a big difference over a season.
If duty cycle exceeds 85% (or higher), that typically means it’s peak weather and the capacity are maxed. That’s fine when it’s an extreme cold snap or extreme heat but not fine if you see high duty on mild days. If so, that could signal undersizing of your system or a restriction due to some other issue. The key is to watch capacity margin output closely. When it’s positive, you’ve got room to spare. A negative margin mean the equipment is operating above its rated capacity. Knowing this enables deciding if you need a tech out to check it out, or whether you would of wanted to do something about insulating the house better.
It converts fuzzy feelings of being uncomfortable to useful information. No guesswork needed.