Fiber Optic Ratio Calculator
Estimate optical power ratio, dB conversion, percentage split, unequal splitter loss, branch output dBm, and link budget margin for each fiber leg.
📌Splitter and ratio presets
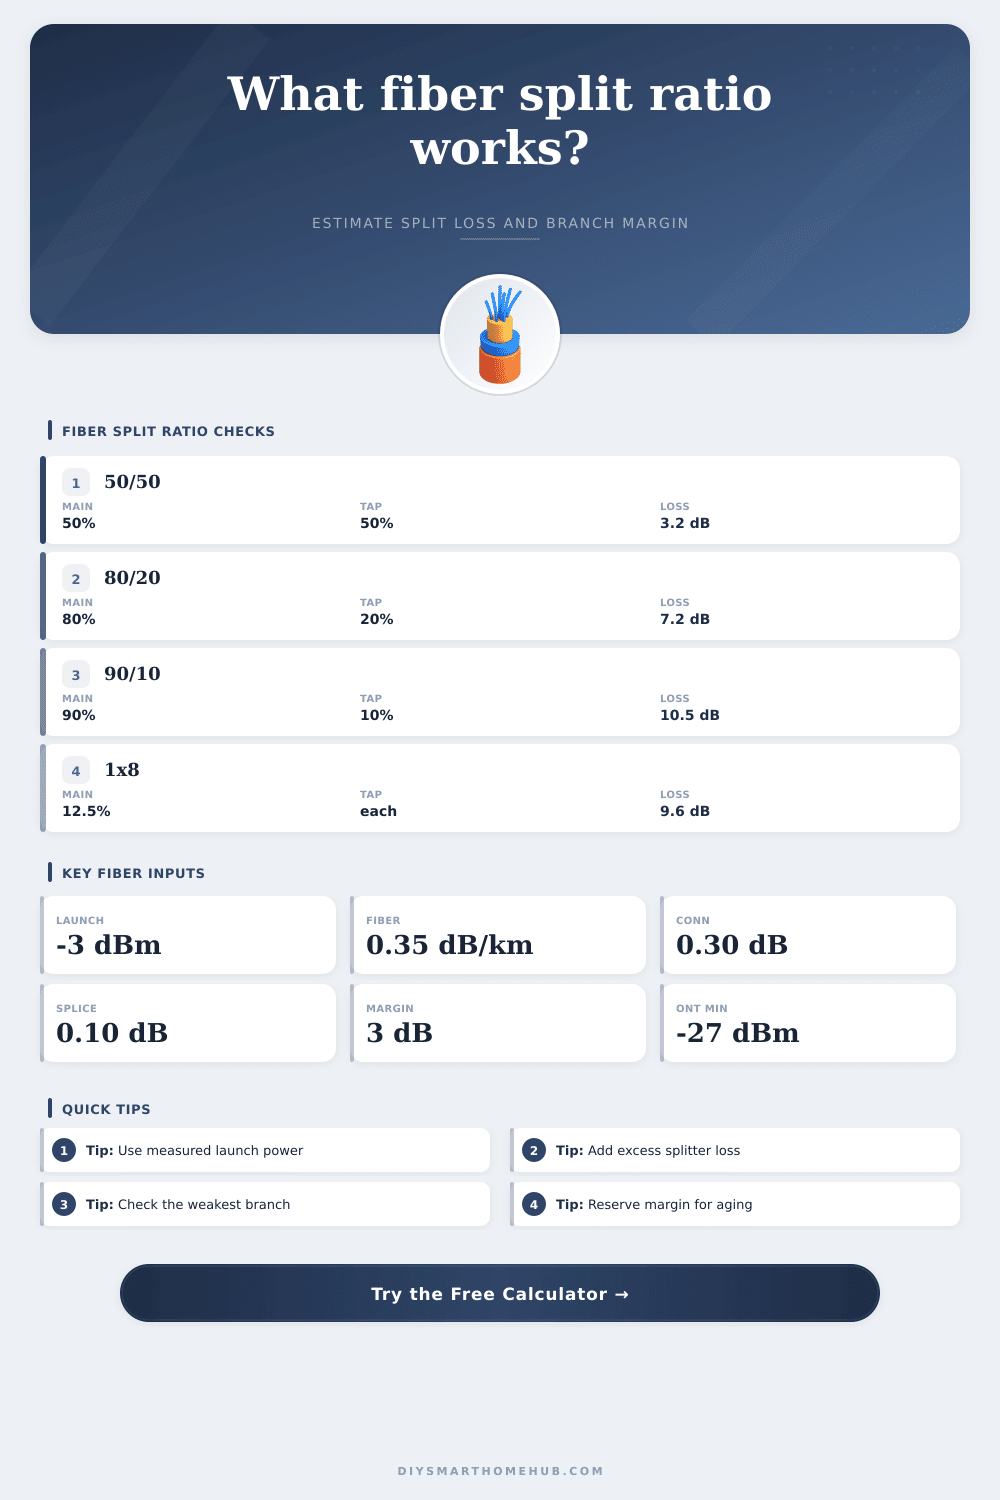
Presets load common equal splitters and asymmetric tap ratios used in home fiber shelves, camera closets, lab checks, and small building optical distribution.
⚙Project inputs
Splitter model
Optical link budget
Fiber ratio result
📊Selected ratio spec grid
Selected output percentage appears after calculation.
Power-ratio dB conversion before excess loss.
Equal splitter reference based on port count.
Default attenuation is adjusted by band.
🗂Fiber splitter reference tables
| Splitter profile | Branch share | Ideal ratio loss | Typical excess loss |
|---|---|---|---|
| 1x2 equal | 50.00% | 3.01 dB | 0.15 to 0.40 dB |
| 1x4 equal | 25.00% | 6.02 dB | 0.30 to 0.80 dB |
| 1x8 equal | 12.50% | 9.03 dB | 0.50 to 1.20 dB |
| 1x16 equal | 6.25% | 12.04 dB | 0.80 to 1.60 dB |
| 1x32 equal | 3.125% | 15.05 dB | 1.20 to 2.00 dB |
| 90/10 tap | 10% tap or 90% main | 10.00 dB tap, 0.46 dB main | 0.20 to 0.70 dB |
| 80/20 tap | 20% tap or 80% main | 6.99 dB tap, 0.97 dB main | 0.20 to 0.70 dB |
| 70/30 tap | 30% tap or 70% main | 5.23 dB tap, 1.55 dB main | 0.20 to 0.80 dB |
| Wavelength band | Planning attenuation | Common direction | Use in calculator |
|---|---|---|---|
| 1310 nm | 0.35 dB/km | Upstream or test source | Conservative short-run budget |
| 1490 nm | 0.28 dB/km | Downstream PON service | Default home fiber estimate |
| 1550 nm | 0.22 dB/km | Video overlay or long reach | Lower fiber attenuation |
| Custom | User entered | Measured cable or datasheet | Use for known plant values |
| Loss item | Typical value | Formula role | Planning note |
|---|---|---|---|
| Optical power ratio | branch percent / 100 | ratio = Pout / Pin | Used before dB conversion |
| dB conversion | -10 x log10(ratio) | turns percent into loss | 50% is about 3.01 dB |
| Fiber span loss | km x dB/km | feeder plus branch length | Band and cable dependent |
| Connector loss | count x loss each | patch and panel penalty | Measure dirty or old connectors |
| Splice loss | count x loss each | fusion or mechanical splices | Small values add across plant |
| Link budget per leg | launch - all losses | branch output dBm | Compare to receiver minimum |
| Common project | Typical split | Length shape | Budget focus |
|---|---|---|---|
| ONT closet to room | 1x2 or 80/20 | Short branch drop | Connector loss can dominate |
| Small apartment riser | 1x8 or 1x16 | Moderate feeder | Splitter loss dominates |
| Detached garage fiber | 90/10 or 1x2 | Long branch drop | Fiber attenuation and margin |
| Camera cabinet tap | 95/5 or 90/10 | Main plus monitor leg | Weak tap output dBm |
💡Practical ratio tips
You yank on a fiber patch cord, and the network goes down. No, the glass didn’t shatter. Chances are it’s because somebody plugged into it without thinking about power budget. Splitters aren’t magic wands. They’re light thieves. Once you input actual distance of each link and your desired split ratio, the calculator does the rest for you.
No more trying to keep all those logarithmic conversions in your head while you look at a blank console screen. That’s where most of the misunderstanding begins: Decibels vs. Percentage. They look at a 50-50 split and think that’s the entire equation: I lose three dB so there’s no problem.
How to Calculate Fiber Power Loss
Nope. That’s just the theoretical perfect way to divide power in half. In real life, your splitter will have some amount of excess loss, typicaly in the two-tenths of a dB range or higher, depending on their quality. Then there are all the connector that you’ll be plugging into or splicing together, each one adding another fraction of a dB. The fractions compound quicker then you might think from looking at a piece of paper.
For example: What’s the difference between a tap and an equal splitter? An equal splits everything equally. Each port receives one-eighth of the total light, which is equal to 12.5% of whatever you’re starting with. In contrast, a tap pulls off just ten percent of the power and sends it to another device or a monitoring leg while keeping most of the juice on primary line.
Because decibels are logarithmic, math gets all wonky. Nine decibels isn’t a ninety-percent loss; it’s actualy a ten-fold loss. That means a tiny miscalculation of tap loss could drop a receiver right down to its breakaway point; resulting in intermittent drops that appear to be software issues but are realy physics failures. You can also choose uneven ratios such as seventy-thirty or eighty-twenty, common when one apartment has a large feed while another receive a more moderate-sized feed for a home run.
You need to check the weakest leg, not the strongest. Even though there may be plenty of power on the main line, the user on the other end complain because his tap leg is starved. After subtracting losses due to connectors, fiber attenuation, and splitters, calculator indicates just how much remaining headroom you still have.
And three decibels is the magic number: If the margin falls under three decibels, it’s time to break out high-wire act. “That’s what most folks don’t understand. They build to an average condition rather than their worst case.” Also note that different wavelengths has different fiber attenuation. Downstream PON traffic runs at 1490 nm with an attenuation of approximately point two eight dB per km. Higher-loss 1310nm sees about point three five.
Run the wrong attenuation coefficient through your brain, and it’ll lead you astray if you’re going to run a long drop out to a remote camera cabinet or detached garage. The page’s reference tables help you select the appropriate value without having to memorize datasheets. They breaks it down by band.
Don’t neglect that design margin. For example, many people give themselves a 3 dB safety buffer for things like dirty ferrules, changing temperatures, etc., so a connection might be “good” today but degraded in two years from being bumped around. No margin equals a gradual network failure versus an all-at-once one. Better to have a bit more margin now than run some more wire later. You should of checked it first.
Examine your numbers and pay close attention to that little number called “link margin.” A positive value indicates you’re okay; a negative value says your signal is too weak for your rig to even detect it. If you’re bordering on it, you might try replacing that tap with something more efficient like an equal split. Or use fewer connector points by replacing some of those patch panels with fusion splices. Each splice is approximately three-tenths of a decibel better than a crappy connector.
Ultimately, it’s all about respecting those losses. Light doesn’t give a crap what you think. It follows the laws of physics and your hardware quality. Running those numbers through the calculator first will make your guesswork into engineering. This means you’re making sure there is enough light to reach its destination so it can keep sending data. Make the signal strong, account for a little wiggle room for error, and use the math to inform your decisions before pulling a single piece of cable.