Coax Connector Loss Calculator
Estimate RF loss from connector interfaces, adapters, coax length, frequency, VSWR mismatch, and outdoor aging so you can see the signal that actually reaches the radio or tuner.
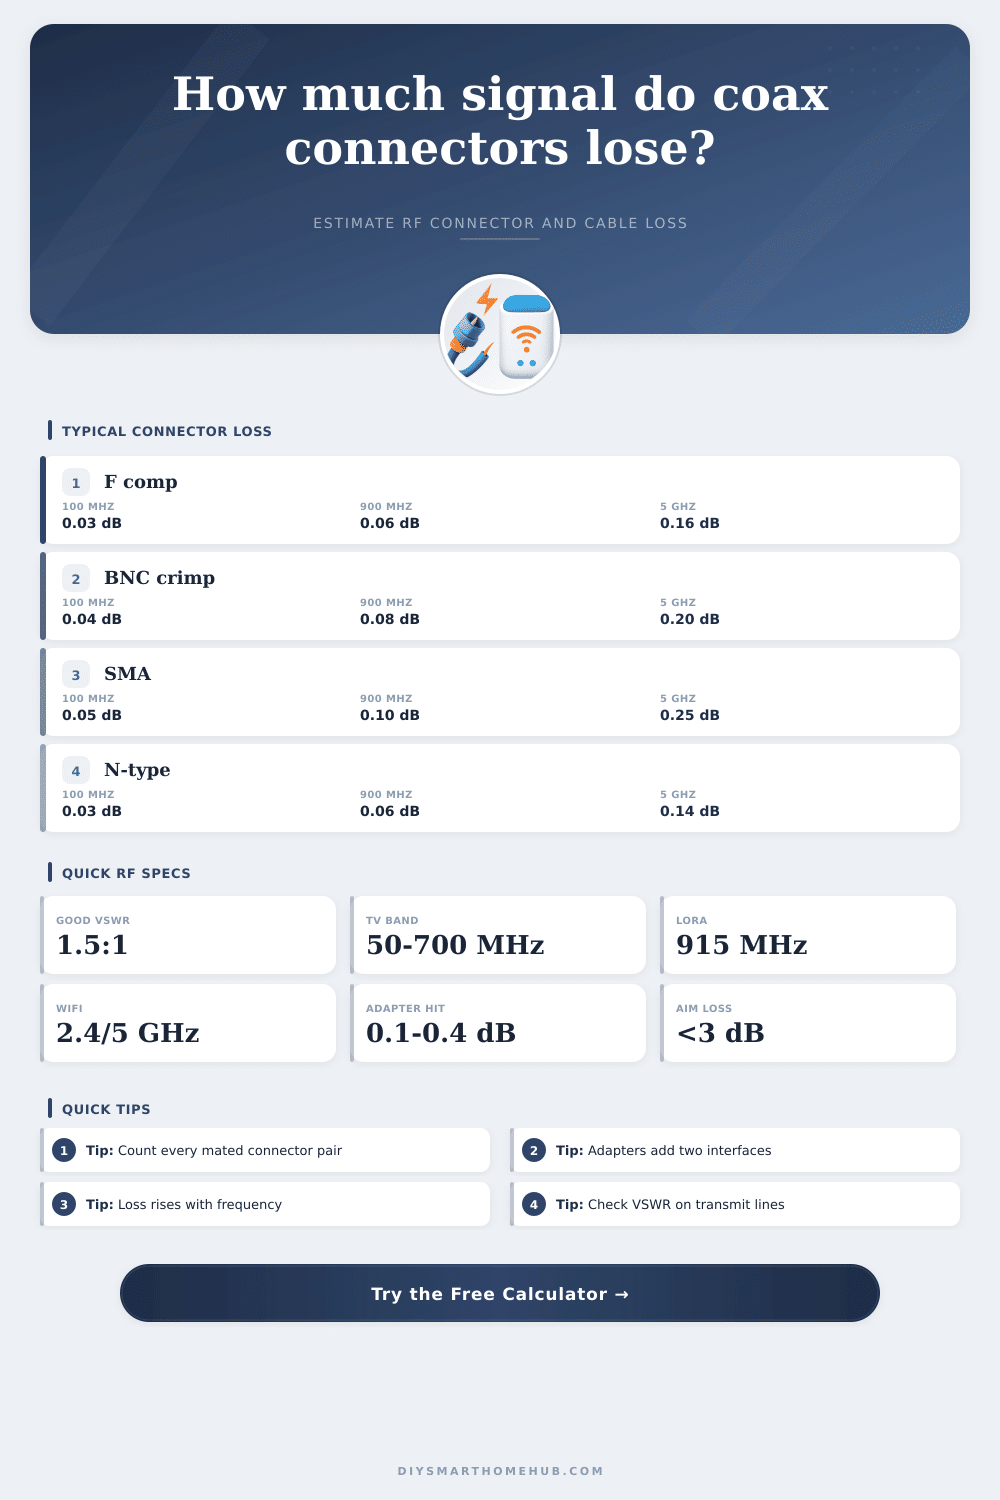
| Connector style | Typical use | Loss at 100 MHz | Loss at 900 MHz | Loss at 5 GHz |
|---|---|---|---|---|
| F compression | TV, cable modem, satellite | 0.03 dB | 0.06 dB | 0.16 dB |
| BNC crimp | Scanner, test gear, CCTV | 0.04 dB | 0.08 dB | 0.20 dB |
| SMA / RP-SMA | WiFi, LoRa, compact radios | 0.05 dB | 0.10 dB | 0.25 dB |
| N-type | Outdoor antennas, LTE, ham | 0.03 dB | 0.06 dB | 0.14 dB |
| UHF / PL-259 | HF and VHF amateur gear | 0.05 dB | 0.18 dB | Not preferred |
| MCX / MMCX | Small SDR and module leads | 0.08 dB | 0.16 dB | 0.35 dB |
| TS-9 / CRC9 | LTE hotspot pigtails | 0.10 dB | 0.22 dB | 0.45 dB |
| Push-on F | Temporary TV jumpers | 0.08 dB | 0.16 dB | 0.36 dB |
| Cable type | 50 MHz | 450 MHz | 900 MHz | 2400 MHz | 5000 MHz |
|---|---|---|---|---|---|
| RG-6 quad shield | 1.4 dB/100 ft | 4.8 dB/100 ft | 6.4 dB/100 ft | 10.7 dB/100 ft | 16.5 dB/100 ft |
| RG-58 | 1.5 dB/100 ft | 7.7 dB/100 ft | 11.0 dB/100 ft | 18.5 dB/100 ft | 29.0 dB/100 ft |
| RG-174 pigtail | 3.0 dB/100 ft | 13.5 dB/100 ft | 20.0 dB/100 ft | 34.0 dB/100 ft | 55.0 dB/100 ft |
| LMR-195 | 1.0 dB/100 ft | 5.3 dB/100 ft | 7.6 dB/100 ft | 13.4 dB/100 ft | 21.5 dB/100 ft |
| LMR-240 | 0.8 dB/100 ft | 3.8 dB/100 ft | 5.4 dB/100 ft | 9.2 dB/100 ft | 14.9 dB/100 ft |
| LMR-400 | 0.4 dB/100 ft | 1.5 dB/100 ft | 2.2 dB/100 ft | 3.9 dB/100 ft | 6.6 dB/100 ft |
| RG-8X mini | 0.9 dB/100 ft | 4.5 dB/100 ft | 6.6 dB/100 ft | 11.8 dB/100 ft | 19.0 dB/100 ft |
| 1/2 in hardline | 0.22 dB/100 ft | 0.85 dB/100 ft | 1.25 dB/100 ft | 2.25 dB/100 ft | 3.8 dB/100 ft |
| Device or service | Common band | Common connector | Loss sensitivity | Planning note |
|---|---|---|---|---|
| OTA TV tuner | 50-700 MHz | F compression | Moderate | Splitters and barrels can matter more than one F connector. |
| Cable modem | 5-1200 MHz | F compression | High | Keep return-path connectors clean and tight. |
| Satellite LNB | 950-2150 MHz | F compression | High | Outdoor sealing affects long-term loss. |
| LoRa gateway | 433/868/915 MHz | N or SMA | High | Short pigtails preserve low-power link margin. |
| WiFi antenna | 2.4/5 GHz | RP-SMA | Very high | Every adapter is noticeable at 5 GHz. |
| LTE router | 700-2700 MHz | SMA, TS-9 | High | Small hotspot pigtails add loss quickly. |
| VHF/UHF radio | 144/440 MHz | N, BNC, PL-259 | Moderate | VSWR mismatch can dominate transmit lines. |
| SDR receiver | Wideband | SMA, BNC, MCX | Varies | Use the highest monitored frequency for estimates. |
| Scenario | Frequency | Length | Connector count | Expected concern |
|---|---|---|---|---|
| Short TV jumper | 600 MHz | 6 ft | 2 | Usually under 1 dB total. |
| Attic antenna drop | 650 MHz | 55 ft | 4 | Cable length matters more than F connectors. |
| LoRa mast feed | 915 MHz | 30 ft | 4 | Use low-loss coax when possible. |
| WiFi pigtail stack | 5000 MHz | 6 ft | 6 | Adapters can be a large share of loss. |
| LTE roof feed | 1800 MHz | 35 ft | 5 | Small modem adapters deserve attention. |
| Ham 70 cm feed | 446 MHz | 80 ft | 4 | VSWR and cable type drive delivered power. |
So you’ve constructed this well-calibrated antenna array. You did the gain calculations. You made sure the polarization is correct. You double-checked the mounting hardware. And then you stick a crummy adapter in there because it was sitting in your junk drawer. That tiny little bit of plastic could be costing you half your signal before it even hits the radio. Everybody who puts together an RF system without considering total impact of these small components gets hit with this at some point or another.
Run those numbers through the coax connector loss calculator above. What was once a vague feeling of something being “not quite right” becomes a real number that you can do something about. Everyone thinks it’s just the cable that makes a difference. They see the attenuation chart for LMR-400 or whatever RG-whatever cable they’re using, and then they quit. It isn’t as simple as that; not entirely.
Why Small Parts Lose Your Signal
When two bits of metal come together, something gives. Nothing is ever perfectly mated. Impedance mismatch slightly, tiny microscopic gaps where reflections bounce back in the opposite direction from where they came. These are barely noticeable at low frequencies such as those found on long-range LoRa at 433 MHz or AM broadcast. With a few adapter bits here and there, no problem, you won’t notice any loss of sensitivity. Push that up to LTE or WiFi and that same lack of perfection becomes a hefty price. That small physical irregularity is suddenly an obstacle. The wavelengths have gotten so small now that anything less than perfect becomes problematic.
The number of interfaces does not equal the number of connectors… That’s why we count them. An interface is a junction, and an adapter actualy counts as two. One end is a male-to-female interface. So is the other. Are you chaining three adapters together to extend a short pigtail or bridge a gender mismatch? Now you’re looking at six separate places where something can go wrong.
Plug in your number of connectors into the calculator, and it’ll do the math for you. No need to multiply little decimal dB figures by hand (they add up fast). It even takes into account which kind of connector you use. For instance, a compression F-connector on a well-run cable modem line is almost invisible. A crimped SMA on a WiFi pigtail will have some loss, too. And then there’s the old ham radio rig with its weathered PL-259, perhaps collecting moisture and leaking signal. The tool accounts for those variations to give you a realistic baseline instead of just an idealized theoretical minimum.
VSWR, or Voltage Standing Wave Ratio, is another silent killer. Not only does it involve the antenna matching the cable but also how the whole system appears as one single impedance to the transmitter. Any impedance change due to crushed or loose connectors causes the impedance to constantly change. Power intended to go down the line reflects and goes off to nowhere or heats up in the connector. That’s power that isn’t going into the load. The calculator has a VSWR input for simulating what happens in the real world with less than perfect components.
Field installations rarely have a perfect 1.0 match. More likely a more reasonable 1.5:1 or 2.0:1 creates significant loss, particularly on transmit lines where every watt matters. Remember, good electrical performance comes down to mechanical quality. But even though this all seems like a theoretical discussion at installation time, the environment matters. A drop of cable in an attic inside your house maintains a fairly consistent environment. A piece of cable sitting on the roof outside faces heat and cold cycles, UV damage, and moisture intrusion. That means that what may have begun as a 0.1 dB loss connector could wander up to 0.3 dB over time due to corrosion of the shielding or deterioration of the dielectric material. You can account for this using the calculator by applying a factor for the roughness of reality. You are accounting for not simply current appearance of the line, but its performance in the long term after the sealant has failed and the temperatures have taken their toll.
It’s not always about removing every last fraction of a dB. Sometimes it costs too much money, or you just can’t do it at all. But understanding what part of the loss comes from where lets you prioritize upgrades that actualy move the needle. Maybe you have more than enough adapter loss, so you’ll switch to a direct-connect cable instead. Or maybe VSWR mismatch is dominating your loss budget, time for a new antenna or a better tuner? Knowing the breakdown helps you focus your upgrades on ones that will realy help, turning RF planning from a guessing game into engineering.
You don’t know what you don’t see. The signal drop off isn’t apparent until it’s gone. That’s when your cable modem re-connects for the hundredth time in an hour. Or the WiFi has dropped to one bar. The radio can’t get a good enough signal on the scanner to pick up a dispatch. The silence doesn’t come till then. But by then it’s too late. Now you have to catch these little losses before they add up into something you need to tear walls down for and replace whole runs of wire.
A couple minutes work here avoids hours of frustration there. It prevents the signal from falling apart altogether. It also makes sure the signal you create gets where you want it to go. Because after all, if you didn’t want it strong and intact, why would of you bothered starting?