Aquarium Water Change Schedule Calculator
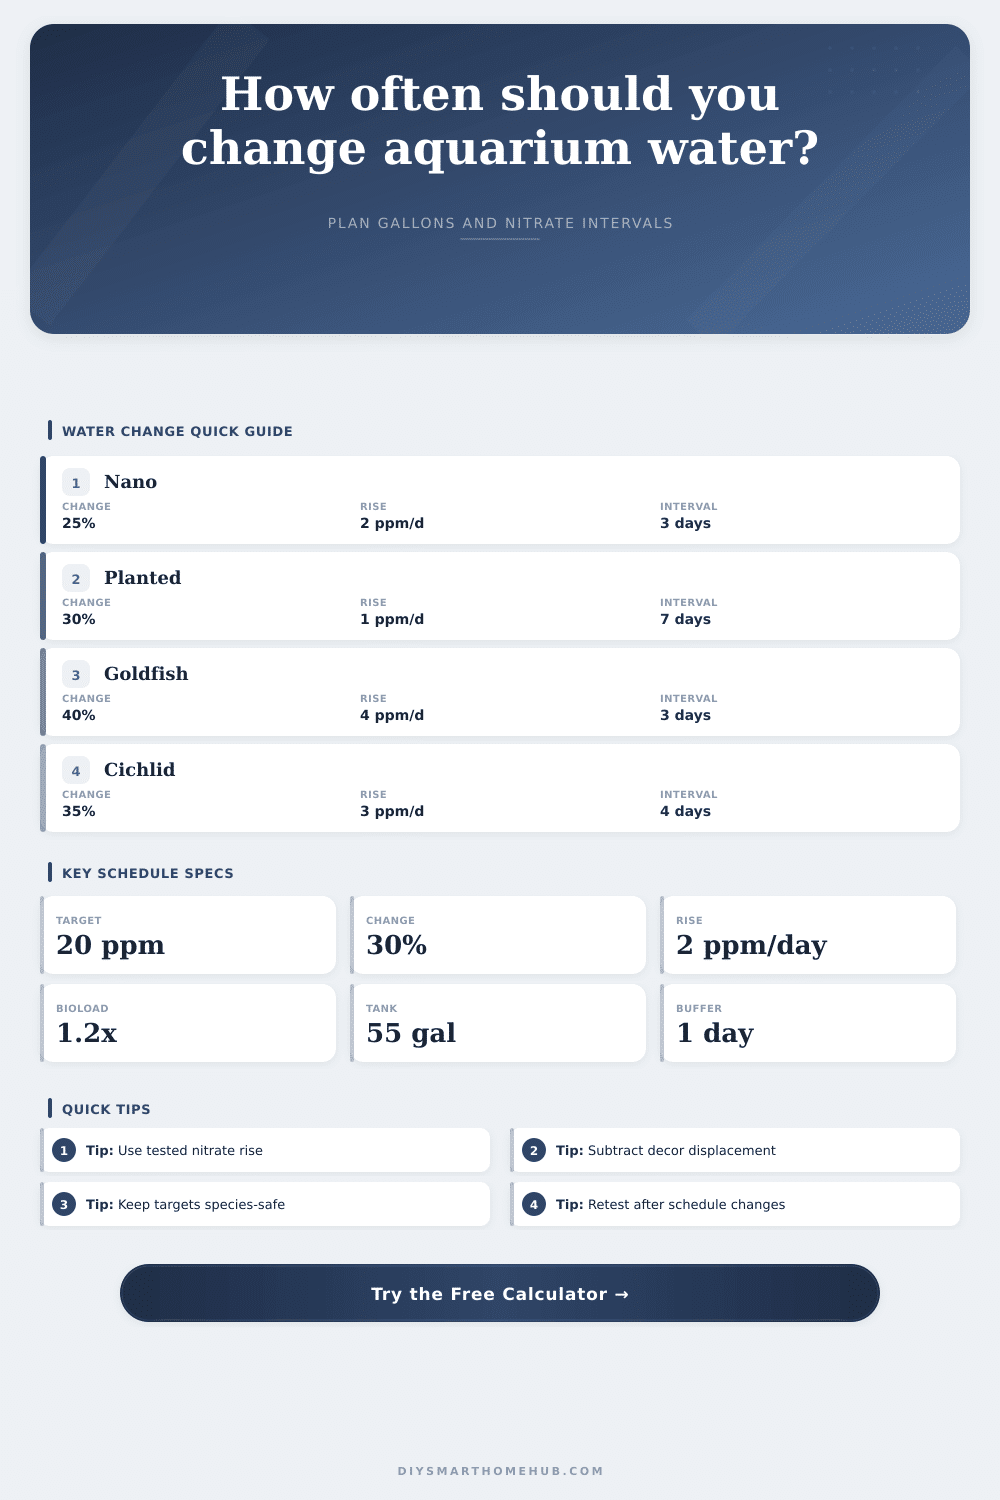
Plan a practical water change interval from tank dimensions, displacement, nitrate rise per day, bioload pressure, target nitrate level, and change percentage.
Detailed water change breakdown
Stable, lightly fed invertebrate tank
Tetras, rasboras, corydoras, livebearers
Moderate stocking with active plant uptake
Large messy feeders with strong filtration
Heavy feeding and mineralized water
| Aquarium type | Typical target ceiling | Why it matters | Schedule note |
|---|---|---|---|
| Caridina shrimp or sensitive nano | 10 to 20 ppm | Small tanks swing quickly and invertebrates dislike rapid chemistry change | Use small changes and a conservative interval buffer |
| Average freshwater community | 20 to 30 ppm | Common fish tolerate moderate nitrate when ammonia and nitrite stay zero | Test weekly until rise rate is predictable |
| Planted aquarium | 20 to 40 ppm | Plants may consume nitrate, but fertilizing can also raise it intentionally | Base the schedule on measured trend, not only stock level |
| Goldfish and large cichlids | 20 to 30 ppm | Heavy waste production can exceed filtration export quickly | Larger changes or shorter intervals are usually needed |
| Reef or marine fish system | 5 to 25 ppm | Corals and nuisance algae goals often set the nitrate ceiling | Coordinate water changes with salinity and alkalinity stability |
| Display tank | Net water after 12% displacement | 20% change | 30% change |
|---|---|---|---|
| 10 gallon aquarium | 8.8 gal / 33 L | 1.8 gal / 6.7 L | 2.6 gal / 10 L |
| 20 gallon aquarium | 17.6 gal / 67 L | 3.5 gal / 13 L | 5.3 gal / 20 L |
| 40 breeder aquarium | 35.2 gal / 133 L | 7.0 gal / 27 L | 10.6 gal / 40 L |
| 55 gallon aquarium | 48.4 gal / 183 L | 9.7 gal / 37 L | 14.5 gal / 55 L |
| 75 gallon aquarium | 66.0 gal / 250 L | 13.2 gal / 50 L | 19.8 gal / 75 L |
| Scenario | Effective change | Adjusted nitrate rise | Target ceiling | Calculated interval | Practical rhythm |
|---|---|---|---|---|---|
| Nano shrimp tank | 14% | 0.6 ppm/day | 15 ppm | 3.5 days by steady-state peak | Small twice-weekly changes |
| 20 long community | 24% | 1.3 ppm/day | 25 ppm | 4.6 days by steady-state peak | Every 4 to 5 days or larger weekly change |
| 55 gallon cichlid tank | 33% | 3.6 ppm/day | 30 ppm | 2.8 days by steady-state peak | Two or three changes per week |
| 75 gallon planted display | 29% | 0.8 ppm/day | 35 ppm | 12.7 days by steady-state peak | Weekly or every 10 days after testing |
Sometimes the nitrate in your aquarium spikes rapidly and cause you stress. And it tends to do this right before the weekend which doesn’t leave much time to respond. Typically, the problem isn’t that you didn’t clean the tank. Rather, it’s that you guessed wrong about your schedule. Doing water changes isn’t simply a chore; it’s also chemical management task. If you don’t know how rapidly nitrates accumulates in your system, then you’re guessing (and that’s never good).
It converts your test results and tank size into a hard set of dates. Begin with what’s in the tank. Manufacturers print display volumes on their tanks. Those figures doesn’t account for rock, sand, driftwood, substrate, or other decor. A twenty gallon tank could have so many big rocks, deep sand, that there are only sixteen gallons of actual water in the tank. Dilution depends on net volume, not sticker volume. If you base dilutions on sticker volume without taking displacement into account, your dilution ratios will be incorrect. Displacement counts when calculating how much fresh water you’ll need to remove contaminants.
How to Manage Nitrates in Your Aquarium
Once you have the real volume, you need to know rate of contamination. That’s where many hobbyists trip up, they don’t measure their system so they go by generic advice. The calculator requires you to enter your measured nitrate rise as parts per million per day. What does that mean? Look at the data. If it’s a heavily planted tank with few fish, there may nearly be no rise. On the other hand if you’re keeping goldfish, you could be spiking by several parts per million per day. You cannot manage what you do not measure.
If you have messy eaters and a steep nitrate climb, it may not be enough to change water weekly. The math may indicate that you should of changing the water every three days. It’s not a suggestion. It’s a chemical reality. Each time it will give you the exact volume of water to change as well as an interval recommendation. There’s no guessing in this approach. Do I really need 25% or does that help? No question, just take out X gallons and the nitrates will stay below whatever ceiling you set.
The reference tables also put it into perspective based off different kinds of tanks. Because shrimp are sensitive to rapid changes (especially fluctuation) and is more prone to waste buildup, they need more frequent, smaller changes. Conversely, cichlids can handle higher nitrate levels but produce a lot of waste so you can get away with infrequent, bigger changes. Knowing these tradeoffs lets you tweak the recommendations if what comes back initially doesn’t fit your lifestyle.
Practicality factors into following the math. For example, you can apply a safety margin so that it tells you when to change water a day (or two) ahead of critical. That way if you get delayed or it’s a busy weekday etc, you’re still good. Likewise, you can define min/max parameters. Don’t suggest once a week for really high waste tanks, once a day for really slow ones, etc. It all comes down to balancing what is possible vs what is chemically perfect.
If the math suggest every forty eight hours but you physically cannot do more than twice a week, then compensate by making sure to change that much more each time. Maintaining an aquarium is not a sprint; it’s a marathon. Doing little things consistently is better then doing big things infrequently. Regular small changes prevents the sudden ups and downs that stress your livestock more than steady, consistent water.
While the calculator can be used as a starting point, the last check is always done through our eyes (and tests). Following the schedule should keep the water clear, and if you see some algae blooming or the water seems cloudy, there’s likely another issue with the water balance. Create a framework using the tool, then make adjustments based off what you’re seeing in the tank. That takes the vague chore of figuring out when to do it and makes it a manageable part of your weekly routine. Instead of worrying about it, trust your system and its rhythm.