Database Growth Projection Calculator
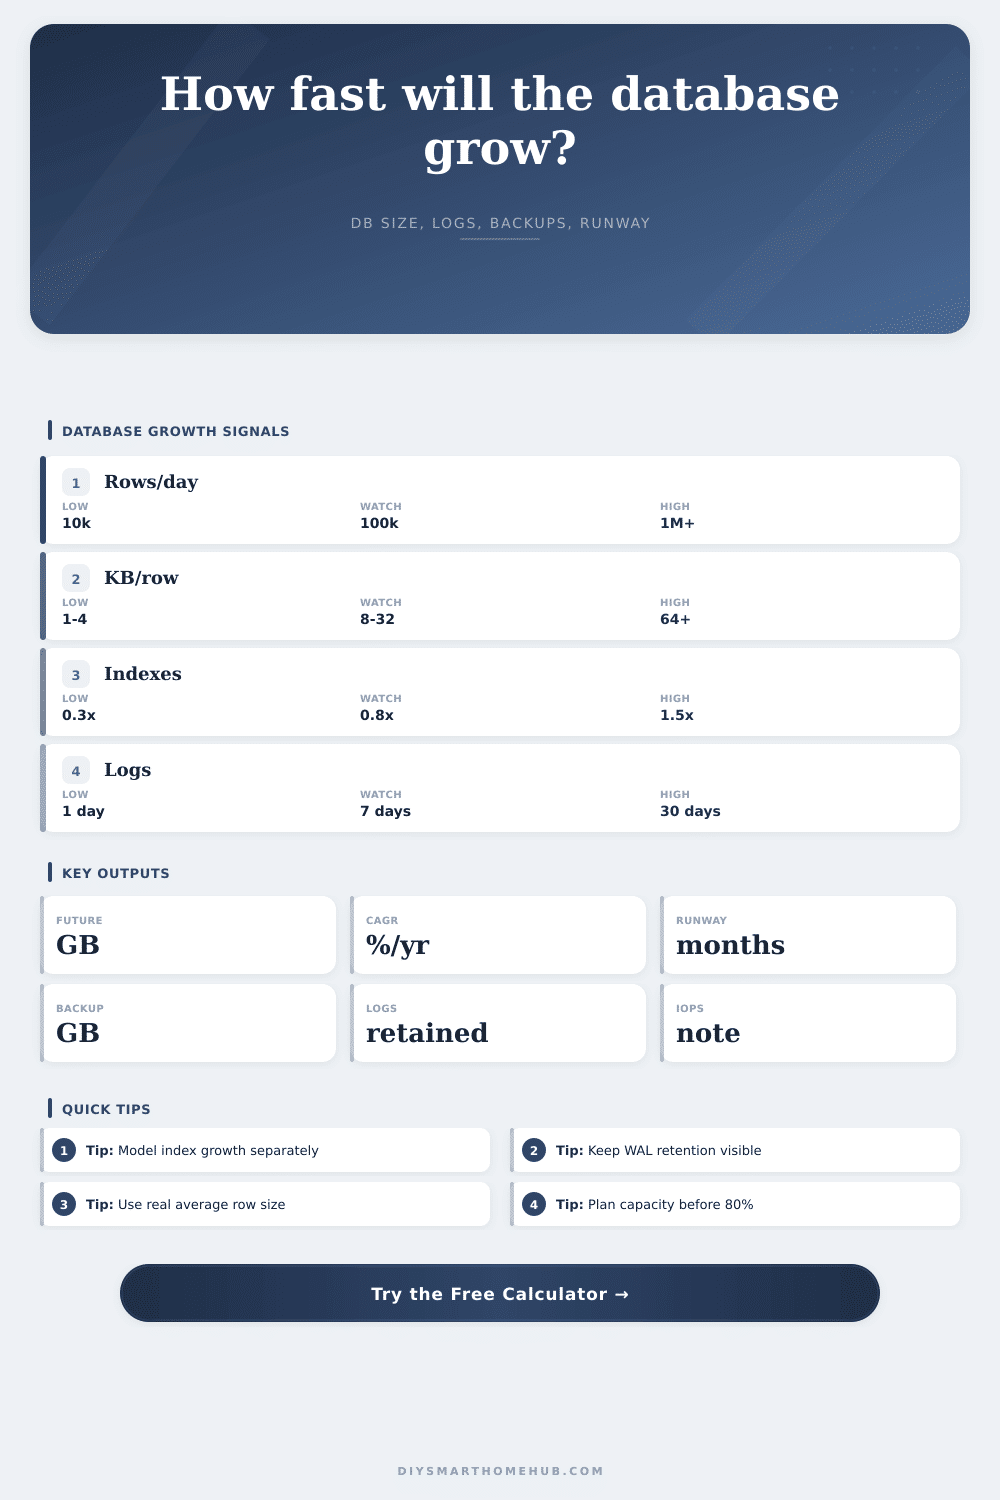
Project future database size from current storage, inserted rows, average row size, index multiplier, WAL or binlog retention, compression, capacity threshold, and the selected forecast window.
Rows per day multiplied by average row KB.
New table data times index multiplier and bloat.
Rolling WAL/binlog storage from retention days.
Insert rate produces light write pressure.
Growth breakdown
| Component | Formula | Result | Storage role |
|---|---|---|---|
| Table data | Rows x KB x days | 0 GB | Primary growth |
| Indexes | Data x index x bloat | 0 GB | Query speed |
| WAL/binlog | Daily data x log x days | 0 GB | Recovery logs |
| Backup | Future x compression | 0 GB | Backup target |
Database profile assumptions
| Profile | Log multiplier | Index range | Best fit |
|---|---|---|---|
| PostgreSQL WAL | 0.9x-1.4x | 0.5x-1.2x | App data |
| MySQL binlog | 0.6x-1.1x | 0.5x-1.5x | Web apps |
| SQLite | 0.1x-0.4x | 0.2x-0.8x | Single node |
| Time-series | 0.6x-1.0x | 0.2x-0.7x | Metrics |
| Analytics logs | 0.8x-1.8x | 0.3x-1.0x | Event ingest |
Capacity planning signals
| Utilization | Status | Action | Reason |
|---|---|---|---|
| Under 60% | Comfortable | Watch trend | Room for spikes |
| 60%-80% | Plan | Schedule growth | Less buffer |
| 80%-95% | Tight | Add capacity | Ops risk |
| Over 95% | Critical | Reduce growth | Low free space |
Common workload references
| Workload | Rows/day | Row size | IOPS note |
|---|---|---|---|
| Home automation history | 50k-500k | 1-4 KB | Mostly light |
| MQTT telemetry | 250k-2M | 0.5-2 KB | Steady writes |
| NVR event metadata | 25k-250k | 4-24 KB | Burst inserts |
| Log analytics | 1M-10M | 1-8 KB | SSD advised |
It’s often just one little mistake that triggers all the problems with storage. Suddenly you start running a telemetry service or installing a new sensor without thinking about disk space. Initially it feels like there’s plenty of room, and then it fills up fastly. Self-hosted projects fails for many reasons, most of which have nothing to do with broken software. The data outgrows your expectations. Plan accordingly so you don’t get caught in crisis mode.
How long before it runs out? That’s where the calculator comes in. It tells you when that will be.
How to Plan Your Storage Space
It translates your row sizes and insert rates into an expiration date. It calculates the cost of index bloat and transaction logs which can consumes just as much room. They often consume as much space as actual table data.
It then lets you know what workload you have. What is your average number of rows per day? For a busy server this could be millions, while on a home system maybe only ten thousand events per day. The total volume is important, but even more important is the size of those entries. A single temperature reading doesn’t consume much room, whereas a complex video event consumes far more then.
Indexes uses a lot of storage. Adding one row updates all the indexes pointing to it. More indexes = more speed, but they gobble up storage faster than just adding rows would suggest. The tool applies a multiplier to account for this. It also accounts for index bloat (waste due to page splits and deleted rows). This is overhead that’s too easily ignored.
“Hey,” you think, “I’ve got a whole year of space left.” But with log files and indexes, it could be only three months.
Another issue is transaction logs. To allow for replication and durability, systems such as MySQL or PostgreSQL maintains these on disk for a period (usually several days, up to weeks). Even when table data remains constant, this log space never shrinks. Your backup plan must account for these logs, which the calculator sizes for you. Compression can reduce backup storage requirement, but won’t affect usage at runtime.
Then there is the output. This is a clear runway. Does it tell you how much longer until you reach the limit? Yes! And that figure is the one telling you what to do next.
If you have a long runway, wait. Short runway: either upgrade hardware or prune some old data.
The reference tables are there for input-checking purposes. How does my workload look relative to typical? Are my numbers far off base compared with norms? Likely you’ve got an indexing problem or an incorrect row size estimate.
Prevention is cheaper than an outage. Grow the storage on your own terms. Don’t wait until 3 a.m. You find that the disk is full.
Look at the tool, and let it tell you what the math looks like. Assume worst-case scenarios. Better to be over-estimating by some amount then under-estimating by the same amount. Make good guesses for your future selfs sake.