Automation Debounce Interval Calculator
Size a smart home debounce interval from burst rate, sensor chatter, maximum trigger rate, minimum stable time, user tolerance, latency buffer, and false-positive behavior.
Debounce interval result
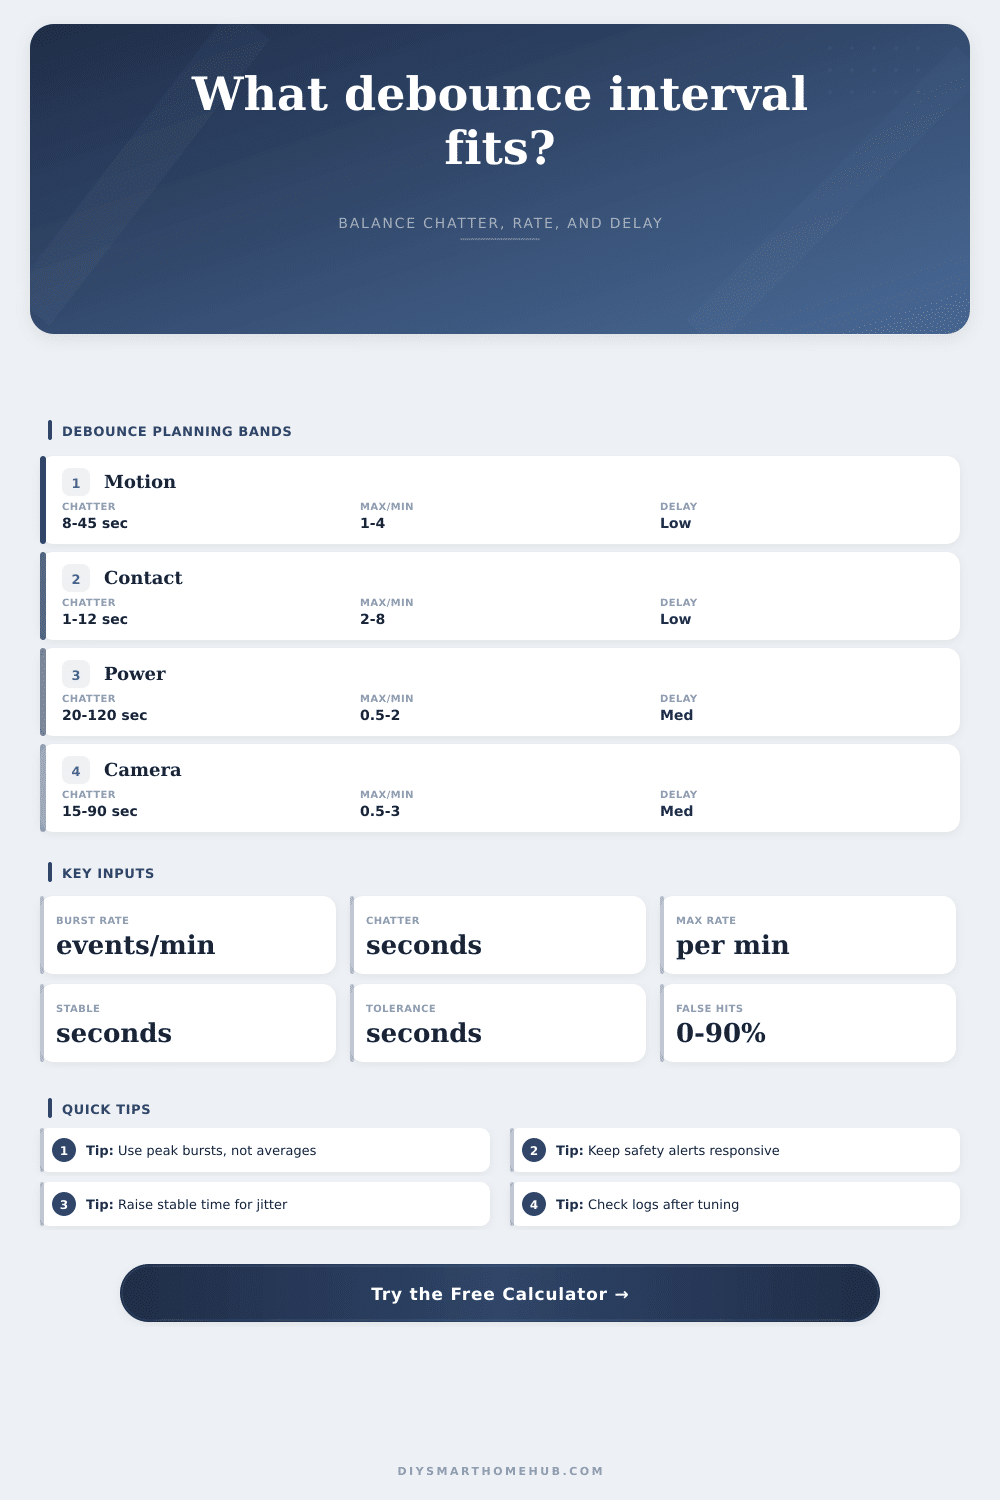
| Source | Chatter | Max/min | Typical goal |
|---|---|---|---|
| Motion sensor | 8-45 sec | 1-4 | avoid repeat light scenes |
| Door contact | 1-12 sec | 2-8 | ignore bounce and double opens |
| Garage tilt | 10-60 sec | 0.5-2 | wait for door travel |
| Environment | 30-300 sec | 0.2-2 | stop threshold chatter |
| Camera motion | 15-90 sec | 0.5-3 | collapse outdoor bursts |
| Step | Formula | Output | Reason |
|---|---|---|---|
| Chatter | input seconds | term A | blocks bounce |
| Rate cap | 60 / max/min | term B | limits trigger count |
| Latency | buffer input | term C | allows device settling |
| Debounce | max(A,B,C) | seconds | largest need wins |
| Stable check | max(debounce, stable) | hold time | state reliability |
| Accepted/min | Band | Common fit | Watch item |
|---|---|---|---|
| 0-0.5 | Very calm | safety and status | slow alerts |
| 0.5-2 | Controlled | rooms and doors | normal delay |
| 2-5 | Busy | motion lighting | repeat actions |
| 5-15 | Noisy | camera zones | event storms |
| 15+ | Extreme | webhook bursts | rate limit |
| False rate | Band | Likely cause | Response |
|---|---|---|---|
| 0-5% | Clean | contact or leak | short debounce |
| 6-15% | Normal | occupied motion | rate cap helps |
| 16-35% | Noisy | outdoor camera | raise stable time |
| 36-60% | Very noisy | threshold jitter | add hysteresis |
| 61-90% | Unreliable | bad source rule | review trigger |
It was midnight. The first notification arrived. The front porch light triggers due to a flicker of heat or shadow, even though you didn’t move and no one else were there. Then it does it again, thirty seconds later. And then again, ten seconds after that.
Nobody moved; no one was there but the system. A shadow, a flicker of heat, something, and the system decided it had to do something about it. That’s sensor chatter, the classic problem: noise disguised as data. Battery life gets sucked away, and hub logs fill up. Instead of feeling like an intelligent home, yours just feels twitchy.
How to Stop Your Smart Home from Faking Alarms
More sensitive hardware isn’t always the answer. What’s the answer? The answer is better timing.
A debounce interval is exactly that: it’s a quiet window during which the system will ignore further inputs following the initial input. If your door contact sensor flutters due to a fluttering draft or magnetic interference, you don’t want to log every micro-flip. You just need to know the door actualy opened.
Plug in your specific noise levels into the calculator above… It does the math for you; and it saves you the guesswork of how to balance responsiveness with stability.
It’s really about knowing what it is you’re measuring. People will look at their average events per day and think, “Oh yeah, my sensor is working.” But they miss the fact that they should of being looking at the busy minute. So if I have a hallway motion sensor and on a normal walk-through, it fired 8 times in one minute, that is your real burden. Your average stats cover up the very spots where the sensor need to debounce, the exact clusters you want to control. So if you use peak, then you know that your interval is strong enough even during the bad moments, rather than just the calm ones.
But what happens after? You’ve got that burst rate. Now you need to compare that with human patience. And that’s where this user tolerance input come in. A five second delay between entering a room and having the lights turn on is annoying; a thirty second delay before a package arrives notification gets sent out is invisible. By comparing the stability you require with the maximum delay you’re willing to tolerate, the tool can help you get to that sweet spot. It’ll let you know if the recommended delay is more than you can tolerate. This is a useful warning, which means the sensor is too noisy for whatever action you wanted it to perform.
And then there’s false positives… Which may sound like a non-issue until you realize how often a leaf blows or a car passes through a camera zone in your busy street. If twenty percent of those events are noise, you need a longer hold time to confirm a real person is there. If twenty percent of those events are noise, you’ll need a longer hold time. The page has a handy reference table that does this by source type. Safety devices like leak sensors require near-zero delay, while thermostats can handle delays of several minutes due to jitter. It’s not arbitrary. It’s a trade-off between accuracy and speed. But safety alerts has to be instant, even though that sometimes means a false alarm. Lighting scenes can be slower, as long as they are reliable.
Latency is the silent killer. Latency is the silent killer of good timing, adding invisible seconds to the chain through hub processing, mesh network hops, and cloud round-trips. The chain includes cloud round-trips, mesh network hops, and hub processing. These invisible seconds adds up. Your sensor may debounce for ten seconds, but if your network has 15 seconds of latency then your automation won’t feel right. The calculator reserves this time by asking for a latency buffer in the formula. In other words, it makes you think about your infrastructure… Not just your sensor.
Be careful tuning these systems: don’t try and get things instantly, rather be a little patient and watch for where the light comes back on and when the sensor resets. Use the presets as a guide. They are based off typical ways actual houses fails. And then tune from there based on your own logs. Pay attention to when the noise stops and the signal remains. That’s when you have it correct. You want a house that responds to you, not the wind.