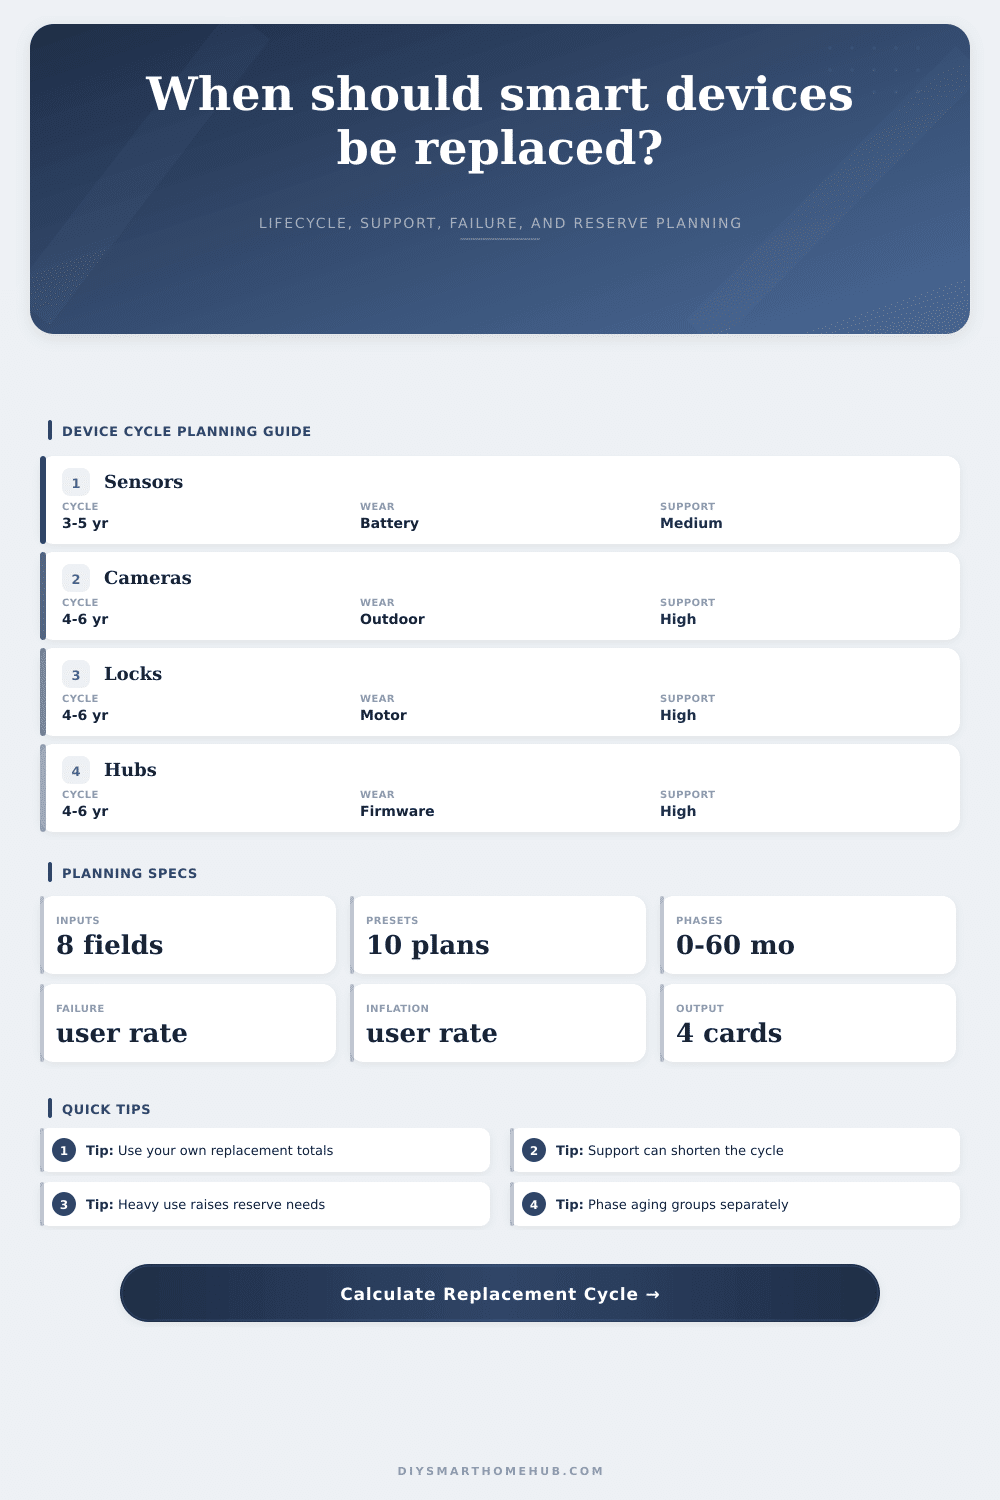
Smart Device Replacement Cycle Cost Calculator
Estimate replacement timing for a group of smart devices using your own total replacement value, lifecycle category, battery or wear factor, firmware support horizon, failure allowance, and inflation assumption.
| Phase | Window | Expected count | Main driver |
|---|---|---|---|
| Phase 1 | 0-12 mo | 0 | Calculate |
| Year | Expected devices | Value factor | Reserve |
|---|---|---|---|
| 1 | 0 | 1.00x | $0 |
| Category | Base cycle | Support weight | Wear driver |
|---|---|---|---|
| Battery sensors | 4.0 years | Medium | Battery and adhesive |
| Cameras and doorbells | 5.0 years | High | Outdoor exposure |
| Smart locks | 5.0 years | High | Motor cycles |
| Thermostats | 7.0 years | High | HVAC compatibility |
| Lighting controls | 6.0 years | Medium | Switching duty |
| Hubs and bridges | 5.0 years | High | Firmware support |
| Speakers and displays | 6.0 years | Medium | Always-on use |
| Moving smart devices | 4.5 years | Medium | Battery and motors |
| Wear profile | Life factor | Reserve effect | Use when |
|---|---|---|---|
| Gentle | 1.12x | Lower | Protected and low cycling |
| Normal | 1.00x | Baseline | Typical indoor service |
| Heavy | 0.82x | Higher | Outdoor or frequent use |
| Harsh | 0.70x | Highest | Heat, cold, or heavy cycling |
The battery powering your door sensor was never top-of-mind until the app stopped refreshing. By then, it is usualy too late. You realize you need a new one, only to discover it use an odd discontinued protocol or you have lost the adhesive backing that no longer sticks to drywall.
Sure, smart devices has a life span and if you ignore them, convenience becomes a maintenance headache. The smart device replacement cycle cost calculator will help you figure out how long that window lasts so you can enjoy the convenience instead of fighting with it.
Why You Should Plan for Replacing Smart Devices
Smart devices aren’t thermostats or light switches: things we plug in and leave there forever. They’re consumer electronics. Batteries degrade, component fail, and software support has a limited window. A door-mounted sensor will be more worn than one on hall. A guest room sensor will be less worn than one cycling 50 times a day. Bunching them all together into a single line-item in your budget is a formula for surprise bills. Instead of guessing with the average, tool above breaks them apart so you can give each class its own support horizon and wear factor.
Where your gut doesn’t help is the wear factor. Indoor usage seem benign, so you may think “it’ll last forever.” But when it’s high traffic; like a robot vacuum running twice a day, that’s actualy very tough. A robot vacuum running two times per day wears down its motor/battery faster then a quiet smart bulb in the ceiling. The calculator accounts for how hard it works. Heavy use or harsh environment will reduce expected lifespan. This will increase the amount of yearly reserves you must save.
Yes, it’s not just repairing broken products. It’s replacing old product before they break entirely.
Firmware support is the quiet killer in the smart home ecosystem. A device might work perfectly well for six years, but what happens if company stops pushing security updates in year four? That’s particularly relevant for locks and hubs. Plug in how many more years of firmware support are available, and it can pushes out the refresh date sooner than your device wears out physically. It’s one of those little things, but it matters for security. You don’t want to have to secure your house with an unpatched device while you wait for its battery to die.
People also ignore another variable in their home budgets: inflation. A dozen sensors cost X dollars today. But they’ll probably cost more when you need to replace them in three years. So the calculator takes into account your future reserve requirements and applies an inflation rate. It spits back out a five year prediction that takes into account what things really cost… Not what they cost yesterday. That lets you smooth out the financial hit. You don’t have to pull out a big chunk when everything goes wrong all at once. You build up a small reserve each year which cover the phased replacements.
If you don’t know how many times a week you use each device, there are some default assumptions baked into the reference tables on page. For example, because of battery chemistry (and adhesive fatigue), lighting controls last longer than battery sensors. So those are the default values, they’ll give you a baseline, but you can tweak accordingly based off your habits. For instance, if you’re in a warm climate, you might have to replace your outdoor cameras more frequent than what the default says.
At its core, thinking about replacements is about taking back the reins on your house’s tech. Instead of scrambling when something breaks (a.k.a. Being reactive), you can be proactive by replacing things before they die. You should of planned ahead. Plug your assumptions and device values into the calculator and it takes care of the math, no more guesswork needed on timing or coefficients. You’ll see exactly how much to save and what to expect.
The point of smart homes is that they’re supposed to simplify our lives, and not leave us with a pile of overdue chores. When you accept that each device has its own lifespan, you keep that promise. You’ll be glad when you swap out a sensor on your own timeline rather than being forced into doing it on someone else’s schedule.