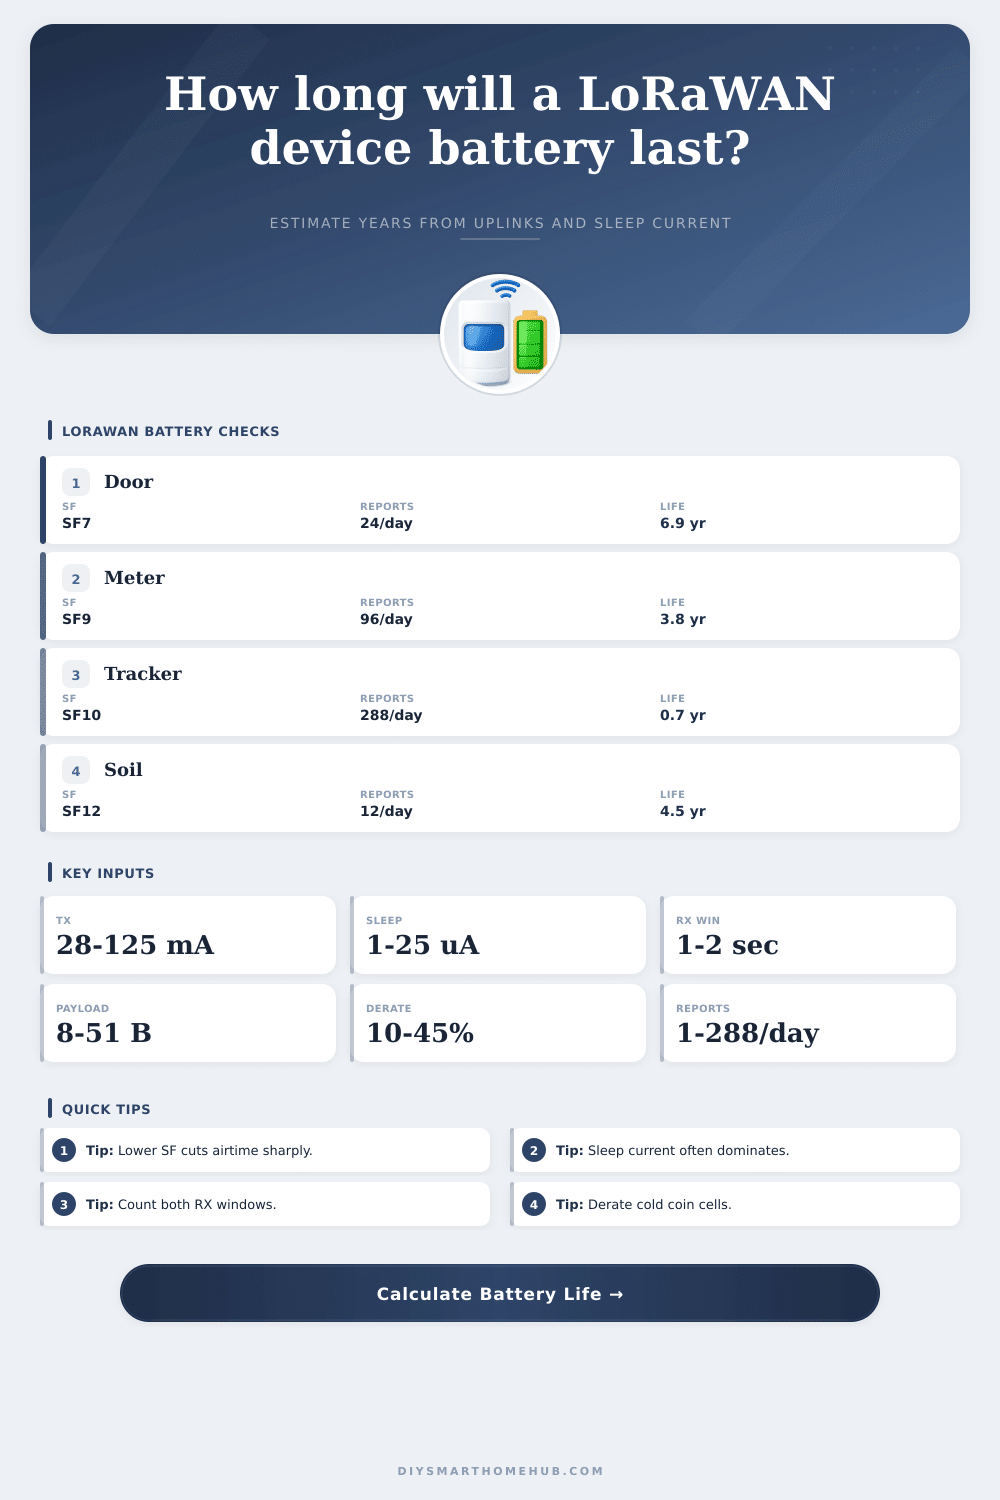
LoRaWAN Device Battery Life Calculator
Estimate LoRaWAN battery life from spreading factor, payload size, uplink count, TX current, receive windows, processing time, sleep current, and battery derating.
📡Device presetsChoose a profile, then tune the radio and battery inputs.
⚙Calculator inputsClass A assumes uplink TX followed by RX1 and RX2 listening windows.
🧮Current comparison gridThese values update from your current inputs.
Battery life results
📊LoRaWAN reference tablesAirtime, report rate, battery, and receive-window effects.
| SF at 125 kHz | Approx DR | Relative airtime | Battery effect |
|---|---|---|---|
| SF7 | Fastest | 1x baseline | Best for short links |
| SF8 | Fast | About 1.8x | Small battery penalty |
| SF9 | Medium | About 3.3x | Noticeable TX increase |
| SF10 | Slow | About 6.1x | Use fewer reports if possible |
| SF11-SF12 | Very slow | About 11x-20x | TX airtime becomes critical |
| Reports/day | Interval | Use case | Battery note |
|---|---|---|---|
| 1-4 | 6-24 hr | Tank, bin, slow sensor | Sleep current usually dominates |
| 12 | 2 hr | Soil or room trend | Good long-life target |
| 24 | 1 hr | Climate, meter summary | Common smart home cadence |
| 96 | 15 min | Utility meter, process node | RX windows start to matter |
| 288+ | 5 min or less | Tracker or active alarm | Battery life drops quickly |
| Battery type | Typical capacity | Derate to try | Best fit |
|---|---|---|---|
| CR2032 coin cell | 220 mAh | 35-60% | Very low current sensors |
| 2x AAA alkaline | 1000 mAh | 30-45% | Indoor sensors |
| 2x AA lithium | 2400 mAh | 15-30% | Outdoor sensor nodes |
| C-cell lithium | 8500 mAh | 10-25% | Long field deployments |
| Li-ion pack | 3000 mAh | 20-40% | Rechargeable nodes |
| Component | Formula | Input source | Why it matters |
|---|---|---|---|
| TX charge | I tx x T tx | TX current and airtime | Rises sharply with SF and payload |
| RX charge | I rx x T rx x 2 | Two Class A windows | Short uplinks still pay RX cost |
| Active charge | I active x T active | Sensor and MCU timing | Warm-up sensors can dominate |
| Sleep charge | I sleep x idle time | Measured node sleep draw | Sets the floor for multi-year life |
| Usable capacity | mAh x derate | Battery chemistry and environment | Prevents optimistic field estimates |
🗂Scenario comparison gridRepresentative planning patterns for smart home and field LoRaWAN nodes.
💡Battery life tips
This calculator is for engineering estimates. Confirm radio settings, regional payload limits, duty-cycle rules, battery pulse limits, temperature behavior, and the real firmware timing on the final hardware.
A LoRaWAN device is supposed to be low power, so you throw a sensor on a door in a warehouse and figure it’ll live out its days there. Big mistake. In all likelihood, the battery will run dry much sooner then you think, typically due to those little currents that build up over time when sitting idle for years.
It’s not just the burst for transmitting that matters. Everything else does too. Enter the calculator, which lets you input your radio settings, crunches the numbers for you and makes you face the true price tag of keeping it alive.
How to Make Your Battery Last Longer
This is where most designers screw up, underestimating sleep current. Everyone gets hung-up on the transmission spike, which sucks down tens of milliamperes for only a fraction of a second. What they overlook is that the device spend ninety-nine percent of its time asleep. A hundredth of a milliampere doesn’t sound like much… But multiply that by eight thousand hours per year and you kill years from the battery. That little bit can mean big trouble if your microcontroller leaks five microamperes rather than one.
Measure entire board, including standby modes in sensors and voltage regulators. Don’t trust the radio chip datasheet number alone. Understanding what’s realy being measured is the trick.
Then there’s the factor of airtime in transmission. Your link budget determines this, and it swings wildly. Range = more spreading factor. Spreading factor = more time. A packet sent at SF7 take one-fifth as long as one sent at SF12. That’s 20x less time the radio must be on, wasting battery power.
Because a strong signal allows you to use SF7, go ahead and do that, every second on air is wasted battery capacity. You can toggle between them instantaneous in the tool, seeing how switching from SF9 to SF10 will cut six months out of a three-year deployment.
Another hidden cost are receive windows. For class A devices, they have to listen for downlinks following each uplink. The protocol says even if you will never get a command back from the gateway, it has to listen in those RX1 and RX2 windows. It also consumes power while it’s listening. If you ignore it, you will give yourself an optimistic estimate which doesn’t reflect what happens in the field.
You may send fewer bytes of data thinking that saves power, when in fact opening receiver longer, or transmitting more often, is a losing battle. Capacity isn’t everything; battery chemistry counts. A large alkaline pack might sound impressive on paper, but while they deliver good capacity in warm environments under light loads, alkalines has trouble at high current pulses and in cold weather. Even though lithium primaries may look like they have a smaller nominal milliamp-hour rating, they perform better in cold weather, hold their voltage during use, and can tolerates a higher amount of current draw.
Because it’s safest to assume you’ll get 30% fewer milliamp hours than the stated number, use a reduction factor to adjust for both temperature variances and battery age. Exactly. Avoid the temptation to squeeze small power transmission gain that comes at the expense of sleep efficiency. One dBm less TX may save a microampere-hour, while a switch to deeper sleep mode may save you megahours.
Focus your attention on the easiest parts of power management first. Make your radio sleep entirely when not in use and make sure peripherals shut down aggressively when they’re not needed. Tighten that up first. Then optimize your airtime.
No model captures all of the variables of field conditions. The spreading factor has to be higher for a device in an enclosed metal box versus in the open air. In winter, battery performance on a cold night will be lower for a sensor sitting in a shed. Your first calculation doesn’t guarantee anything, it’s just a starting point. It points you towards the bottleneck.
If you calculate two years but actualy need ten, you already have your answer. You would of needed to reduce report frequency or switch battery chemistries. In the end, endurance is all about precision and patience. Bigger batteries won’t brute force it if your code leaves the device awake for too long.
Think of your battery as a finite tank of gas on a roadtrip, each unnecessary stop burns gas and every inefficient turn wastes miles. Respect the silent drain of sleep. Measure at the board level. Plan for the worst case. Often the difference between a reliable install and a failed prototype depends based off these quiet moments between communications.