Motion Sensor Coverage Overlap Calculator
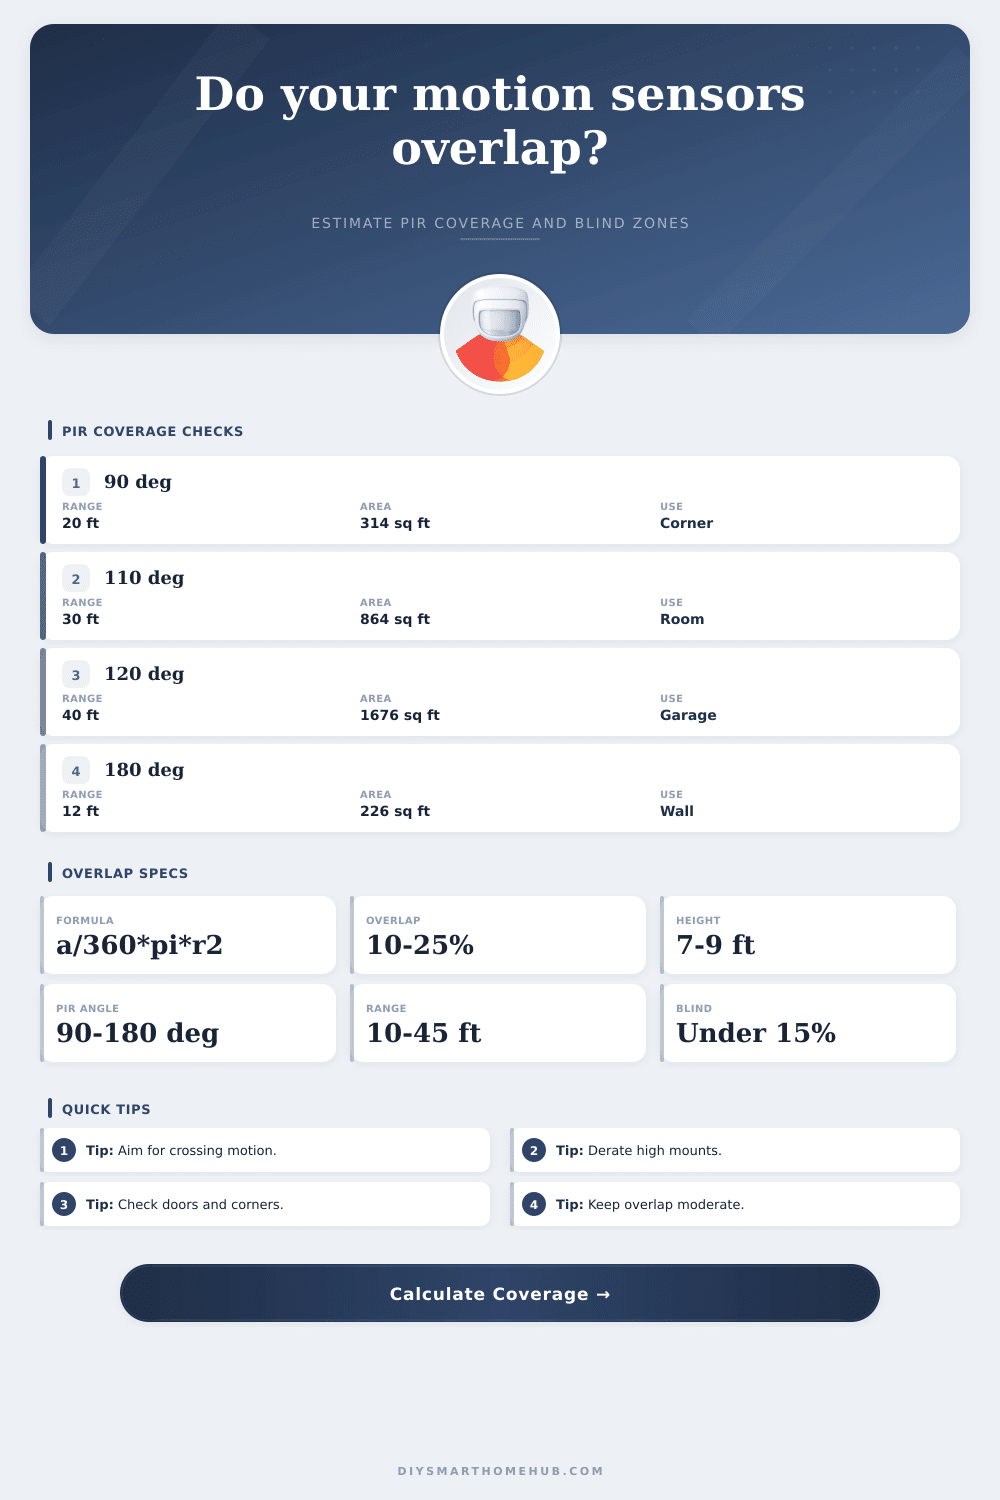
Estimate PIR sector area, sensor-to-sensor overlap, effective range after mounting height derate, and likely blind zones for rooms, garages, hallways, and smart home security zones.
🚨Coverage presetsPick a real layout, then tune the inputs.
⚙Calculator inputsAll math is converted to feet internally.
📡Sensor spec snapshotLive assumptions used in the result.
Coverage results
🧭Coverage comparison gridHow different layouts usually behave.
Wide room watch
One or two 90 to 120 degree PIRs can cover the walking paths well, but furniture can create corner blind zones.
Cross coverage
Facing sensors across a space improves handoff and catches motion across PIR zones, with higher overlap than a parallel layout.
Hallway chain
Narrow beams or repeated PIRs work best when spacing is below the derated range and overlap stays near the target.
Grid coverage
Ceiling occupancy sensors spread evenly over desks or open rooms, but high ceilings require stronger range derating.
📋Motion sensor reference tablesFormulas, ranges, mounting, and layouts.
| Formula | Expression | What it means | Use |
|---|---|---|---|
| PIR sector area | angle / 360 x pi x r² | Floor area of one cone | Base coverage |
| Circle overlap | 2r² acos(d / 2r) - 0.5d sqrt(4r² - d²) | Shared reach between two equal ranges | Overlap estimate |
| Sector overlap | circle overlap x angle / 360 x layout factor | Useful duplicated PIR sector area | Adjacent sensors |
| Blind zone | room area - unique coverage | Likely uncovered floor area | Gap screening |
| Height derate | sqrt(range² - vertical delta²) / range | Horizontal reach from mount to target height | Range correction |
| Sensor profile | Typical angle | Range factor | Best use |
|---|---|---|---|
| Wall PIR | 90-120 deg | 1.00 | Rooms, entries, garages |
| Ceiling PIR | 180-360 deg | 0.92 | Occupancy and open desks |
| Dual-tech | 90-120 deg | 1.05 | Reliable occupied zones |
| Curtain PIR | 10-30 deg | 0.95 | Doors, windows, hall edges |
| Pet immune PIR | 80-110 deg | 0.82 | Lower false alarm layouts |
| Outdoor PIR | 90-180 deg | 0.78 | Porches and side yards |
| mmWave | 90-140 deg | 0.88 | Presence-sensitive rooms |
| Room or zone | Common area | Sensor count | Overlap target |
|---|---|---|---|
| Bedroom | 120-180 sq ft | 1 | 0-10% |
| Living room | 250-450 sq ft | 1-2 | 10-20% |
| Open plan | 500-900 sq ft | 2-4 | 15-25% |
| Hallway | 80-220 sq ft | 1-3 | 15-30% |
| Garage | 300-600 sq ft | 1-2 | 10-25% |
| Whole house core | 1200-2500 sq ft | 4-8 | 12-22% |
| Mount height | Target height | Derate behavior | Planning note |
|---|---|---|---|
| 6.5-8 ft | 3-4 ft | Small vertical loss | Typical wall PIR range |
| 8-10 ft | 3-4 ft | Moderate loss | Check far corners |
| 10-12 ft | 3-4 ft | Noticeable loss | Use stronger range margin |
| 12-16 ft | 3-4 ft | High loss | Ceiling or outdoor ratings matter |
| Pet immune | 1.5-2.5 ft | Higher vertical delta | May reduce low-zone detection |
💡Coverage planning tips
This calculator is for placement planning and coverage screening. Confirm final sensor behavior with the device manual, actual walk tests, automation logs, and any alarm-system requirements.
In test videos where a human walks directly from doorway to middle of room, most motion sensors do just fine. The real world, however, is not so tidy. There’s furniture blocking sensor sight lines, pets pacing near legs, and corners falling completely out of the detection cone. That difference between theory and practice is typically how security systems fall down. It is not because they turn on the lights or trigger an alarm. But simply because they don’t see you at all as you walk along side of living room instead of right in front of them.
You don’t need to visualize any overlap in your head. The calculator figures that for you. Most importantly: Know WHY you put the inputs in there.
How to Place Your Sensors Correctly
The first input is about mounting height. A wall sensor at eye-level (or at a 10 foot ceiling) will behave very differently than one eight feet off the ground. The distance from the lens to the target height reduce its horizontal reach. A “thirty foot range” doesn’t mean it sees all the way out to thirty feet. Actual range will be less if the lens is positioned higher. This is because angle tilts down toward floor instead of projecting out horizontally. That’s what folks misunderstand. They’ll spend big bucks on fancy gear and then cripple it with poor placement, starving it of effective coverage.
The equation also depends on sensor types. Standard PIR units sense heat differential relative to some kind of background, so they can absorbs sensitivity to amount of furnitures in a space, as well as the room’s overall temperature. Add dual-tech and you get radar/microwave sensing that can pick up motion even if thermal signatures are weak. Make it pet-immune and it’ll simply ignore anything near your base plane that looks like low-lying movement, avoiding false positive alerts caused by dogs chasing their tails. Every profile has its own reliability factor that changes how large an area it covers effectiveley.
An open bedroom will likely require fewer sensors than a cluttered office filled with shelves of books, since obstructions can block line-of-sight. To deal with this, the tool applies obstruction factors that limit usable coverage based off actual detection zone interruptions by sofas and walls.
That’s where the real world meets your plan: overlap. Ideally there will be some, so that if you walk from one area with a sensor into an adjoining one, it can pick up motion. But too much, and you waste money (and create confusing logs of which automations did what). Fifteen to twenty percent tends to be that sweet spot. Less than that means possible blind spots when moving from one covered area to another; more than that, and you’re paying for redundant coverage with no gain in security. If you chain sensors along a hall, or face them across a space, the math shows how far apart they need to be to achieve that sweet spot. In uneven rooms there will always be some blind spots, but ideally they shouldn’t exceed fifteen percent. Anything over 15 percent means that your system might not work reliably.
With the results you get a blind zone percentage along with a unique coverage number so that you know exactly what’s protected and what isn’t. Based off that, determine if a third sensor would help make sense or if you could just move one of the sensors near the troublesome corner to solve it. The page also has a series of reference tables illustrating typical range/angle combinations for various profiles, so that you can have some reasonable expectations going into wall measurements.
Wide angle sensors are generally good for corners (they tend to catch the entering motion). The opposite setup is best for cross-coverage, but does need to be aligned carefully enough so that there isn’t too much overlap. For hallways, narrow beams and/or close beam spacing help ensure no gaps between them. Where do people walk (not where you think they’ll be)? Put devices there so they capture movement over pathways. Don’t just monitor static locations. Mount at appropriate heights as this impacts range much more different than most people realize. You want moderate overlap to ensure reliable coverage while maintaining some efficiency.
When your blind zone stays small and the numbers align, congrats. You’ve got something that works, not just on paper, but out in the field. It’s really mostly knowing what to expect when you measure things, and how to place devices appropriatley to capture that. You should of known more about placement before starting.