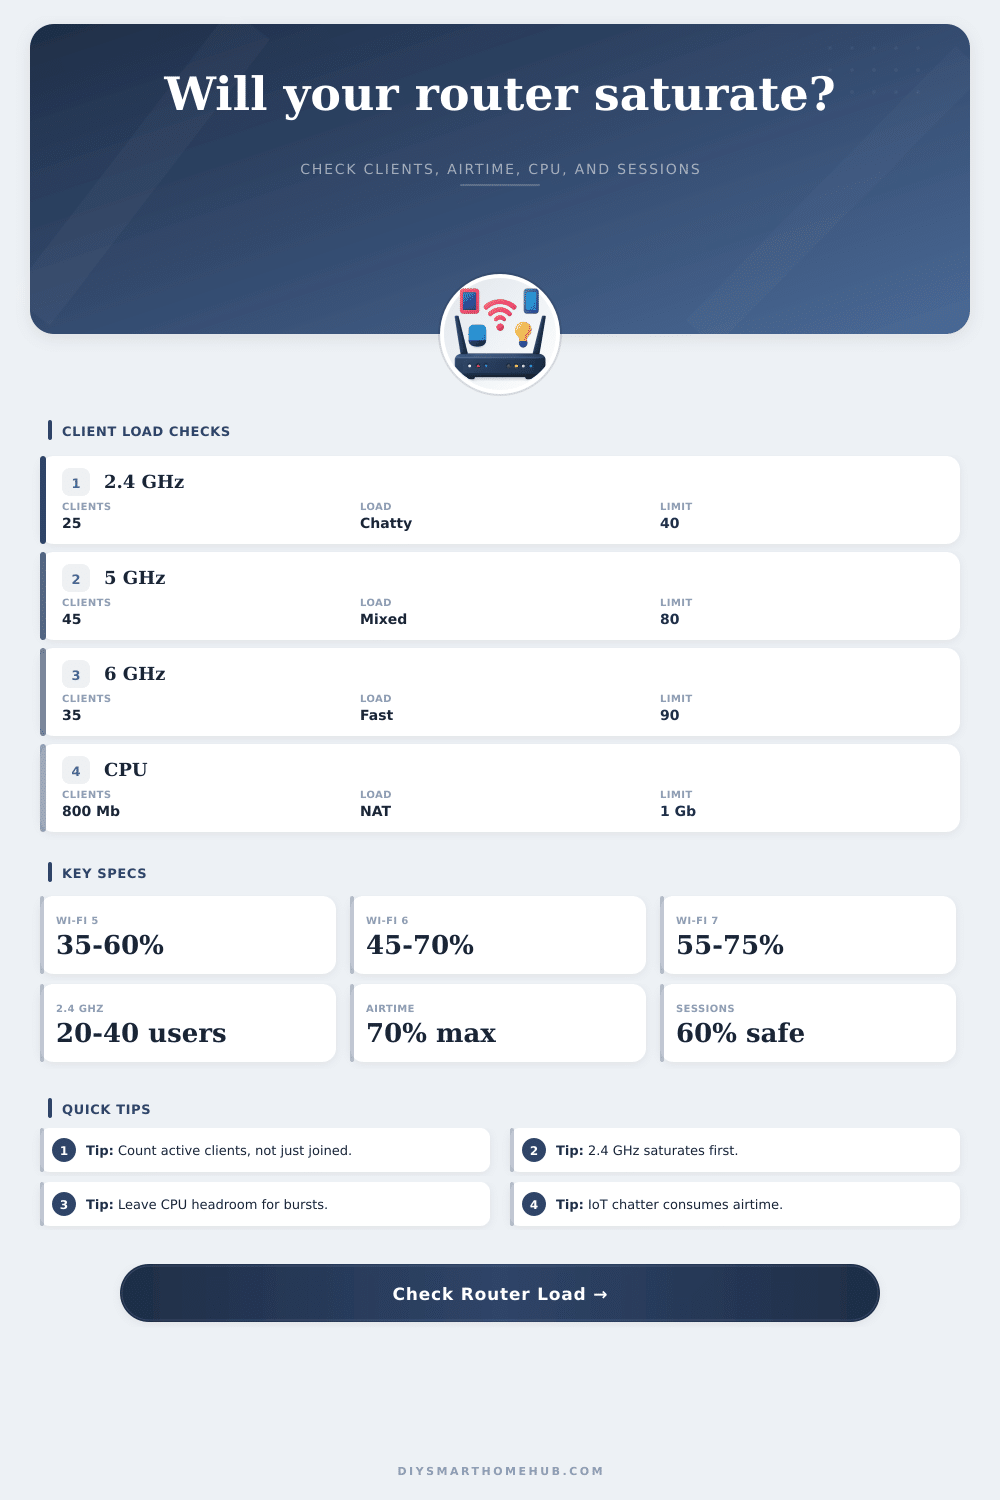
Router Client Saturation Calculator
Estimate whether a router or mesh node is running out of Wi-Fi airtime, per-band client capacity, routed throughput, CPU headroom, or connection tracking sessions.
📶Router load presetsStart with a realistic home network, then tune the numbers.
⚙Calculator inputsUse router spec-sheet PHY rates when known.
📊Live spec snapshotPractical capacity after overhead and reserve.
Saturation results
🗂Router class comparisonUse this as a sanity check against the calculator output.
| Router class | Typical bands | Usable Wi-Fi share | Practical joined clients | Heavy active clients | CPU/session watch | Best fit |
|---|---|---|---|---|---|---|
| AC1200 Wi-Fi 5 | 2.4 + 5 GHz | 35-55% of PHY | 30-55 | 8-18 | Older NAT CPU, small RAM | Apartment or light smart home |
| AC2200 tri-band | 2.4 + dual 5 GHz | 40-60% of PHY | 50-85 | 14-28 | Mesh backhaul consumes one radio | Mixed streaming and browsing |
| AX1800 Wi-Fi 6 | 2.4 + 5 GHz | 45-65% of PHY | 55-95 | 18-35 | QoS and security features | Modern family network |
| AX3000 Wi-Fi 6 | 2.4 + 5 GHz | 50-68% of PHY | 75-125 | 25-45 | Gigabit NAT limit | Busy smart home or office |
| AXE5400 Wi-Fi 6E | 2.4 + 5 + 6 GHz | 50-70% of PHY | 100-170 | 35-65 | WAN speed and sessions | Dense client mix with 6E devices |
| BE9300 Wi-Fi 7 | 2.4 + 5 + 6 GHz | 55-75% of PHY | 130-220 | 50-90 | Multi-gig routing and heat | High throughput, low latency clients |
📋Reference tablesBand limits, protocol overhead, activity, and router state pressure.
| Band | Typical role | Practical clients | Saturation clue |
|---|---|---|---|
| 2.4 GHz | IoT, distant devices | 20-40 joined | High airtime from slow clients |
| 5 GHz | Main phones, laptops, TVs | 40-90 joined | Throughput drops during bursts |
| 6 GHz | 6E/7 modern clients | 50-100 joined | Fast near AP, weaker through walls |
| Mesh backhaul | Node-to-node traffic | Shared with clients | Consumes extra airtime |
| Wired clients | Switch or Ethernet | CPU/session limited | Bypasses Wi-Fi airtime |
| Generation | Capacity features | Efficiency to try | Practical note |
|---|---|---|---|
| Wi-Fi 5 | 5 GHz MU-MIMO downlink | 35-60% | Works well, weaker dense-client handling |
| Wi-Fi 6 | OFDMA, 1024-QAM, TWT | 45-70% | Better small-packet and dense use |
| Wi-Fi 6E | Wi-Fi 6 plus 6 GHz | 50-70% | Extra clean spectrum for capable clients |
| Wi-Fi 7 | MLO, 4K-QAM, 320 MHz | 55-75% | Best with Wi-Fi 7 client support |
| Mixed legacy | Older clients and narrow channels | 25-50% | Use lower efficiency if many old devices |
| Client activity | Active share | Mbps each | Use case |
|---|---|---|---|
| Quiet IoT | 5-15% | 0.1-1 | Sensors, bulbs, plugs |
| Browsing home | 15-35% | 2-6 | Phones and laptops |
| Streaming evening | 30-55% | 8-25 | TVs, calls, tablets |
| Work calls | 35-65% | 4-12 | Video, screen share, cloud apps |
| Guest burst | 50-85% | 3-10 | Many phones active at once |
| Router limiter | What to enter | Comfort zone | Warning sign |
|---|---|---|---|
| Routed throughput | NAT/firewall Mbps | Under 70-80% | CPU spikes during speed tests |
| Session table | Max tracked flows | Under 50-65% | New pages stall or calls drop |
| Airtime | Band demand / usable band Mbps | Under 70-80% | Latency rises before speed fails |
| Client count | Joined clients by band | Below practical band cap | Association retries or roaming loops |
| Reserve | Future device buffer | 10-25% | No margin for guests or bursts |
🧮Common project size tableStarting points for smart homes and small offices.
| Scenario | Joined clients | Active clients | Recommended router class | Main risk |
|---|---|---|---|---|
| Small apartment | 15-30 | 5-10 | Wi-Fi 5 or AX1800 | 2.4 GHz crowding |
| Family smart home | 45-75 | 15-28 | AX3000 or better | Streaming bursts |
| IoT heavy home | 80-130 | 12-35 | Tri-band Wi-Fi 6/6E | 2.4 GHz airtime |
| Home office | 35-65 | 18-35 | AX3000/AXE5400 | CPU with VPN/QoS |
| Guest gathering | 90-180 | 45-120 | 6E/7 or multiple APs | Sessions and airtime |
💡Router saturation tips
This calculator is for planning and comparison. Real router behavior varies with firmware, antennas, client chipsets, interference, channel width, security mode, DFS events, mesh topology, and enabled services.
It’s unlikely that your internet plan is breaking your router. You’ve got gigabit service coming into wall, but when the fam comes home, smart bulbs go dark and video calls stall. Bandwidth’s not the problem. More often than not, it’s client saturation. Before the router reach the speed limit, it runs out of something else: session table entries, CPU cycles, airtime. Instead of thinking of Wi-Fi as a highway with lanes, think of it more as a dinner party where everybody speaks at once, eventually nobody will be heard by the host.
So to start with: “joined” clients ≠ “active” clients. You may see 40 devices connected on your router’s dashboard, but just 10 of them is actively sending or receiving data in this exact moment. All calculations depend off this difference. And that’s where the tool above come in handy. It allows you to distinguish between how many devices are present vs. It shows how many are busy, helping you sift through signal and noise.
Why Your Wi-Fi Is Slow
Treat a sleeping laptop as though it were streaming TV? You’re oversizing and buying unneeded hardware. Treat a chatty smart thermostat as though it’s an idle sensor? You’re underestimating its airtime drain and wondering what’s causing all that network lag.
OFDMA changes the math a bit with Wi-Fi 6. Instead of having each device take its turn on a transmission slot, there are now multiple slots within one slot so several devices can shares the same time. That makes them more efficient in a crowded environment but it still doesn’t add any free energy. The calculator includes this in equation through an efficiency percentage variable.
You may find that your usable throughput is only thirty-five percent of the advertised PHY rate for Wi-Fi 5 router. And for a moddern Wi-Fi 6 (or 7) device, that jumps up to around sixty or seventy percent. Those numbers consider management frames, retries, contention and MAC overhead. This is what most folks miss when comparing spec sheets.
Then there’s the 2.4 gigahertz band, which is usually where the trouble starts. That’s where we tend to throw our older IoT devices and smart home sensor, which all tend to be sending out relatively little data at a time in slow bursts. They hog up the medium, a small packet takes a long time to travel so they take up air for a long time. One temperature sensor might be using up as much air than a data-heavy laptop downloading a movie, but it’s doing it frequently with small packets.
That band gets its own treatment on the calculator, and it’s important. Even though your overall megabits used may look reasonable, if you overpopulate this band with legacy devices, it will quickly become full. Migrating capable clients from that band to higher ones (like 5 gigahertz or 6 gigahertz) will relieve that right away.
The other silent killers are CPU and session tables. Sessions, that is, multiple connections opened simultaneously by a web page when they load, easily runs into the hundreds in modern browsers for each tab. Your router will have some kind of connection tracking table and when it fills up (which it does quickly if you’ve got a small one) it’ll start dropping new packets, stalling out sites or cutting off calls… Even though you still have lots of airtime on the Wi-Fi.
You can enter the throughput capacity of your router and its session limit into the tool so it could of tested for this particular headroom. Keeping usage below sixty-five percent keeps things comfortabley while accommodating occasional bursts without panicky packet drops.
And what about growth? Don’t forget to plan for that too. That way you don’t max out your network just as grandma arrives on Christmas Eve and all your friends is over visiting. While the presets will give you some reasonable starting places, it’s always best to tune based off how you use your network. Keep an eye on latency spikes first, that will warn you of saturation before throughput drops.
Balancing all these factors gives you a more accurate view of where your network realy fails. In short: Saturation management comes down to pacing. That means more than just checking the box’s marketing numbers; it means knowing how devices behave as they are. The point is to manage both new Wi-Fi 7 upgrades and the reorganization of existing clients. Ensure the discussion continues but no one shouts everyone else down.