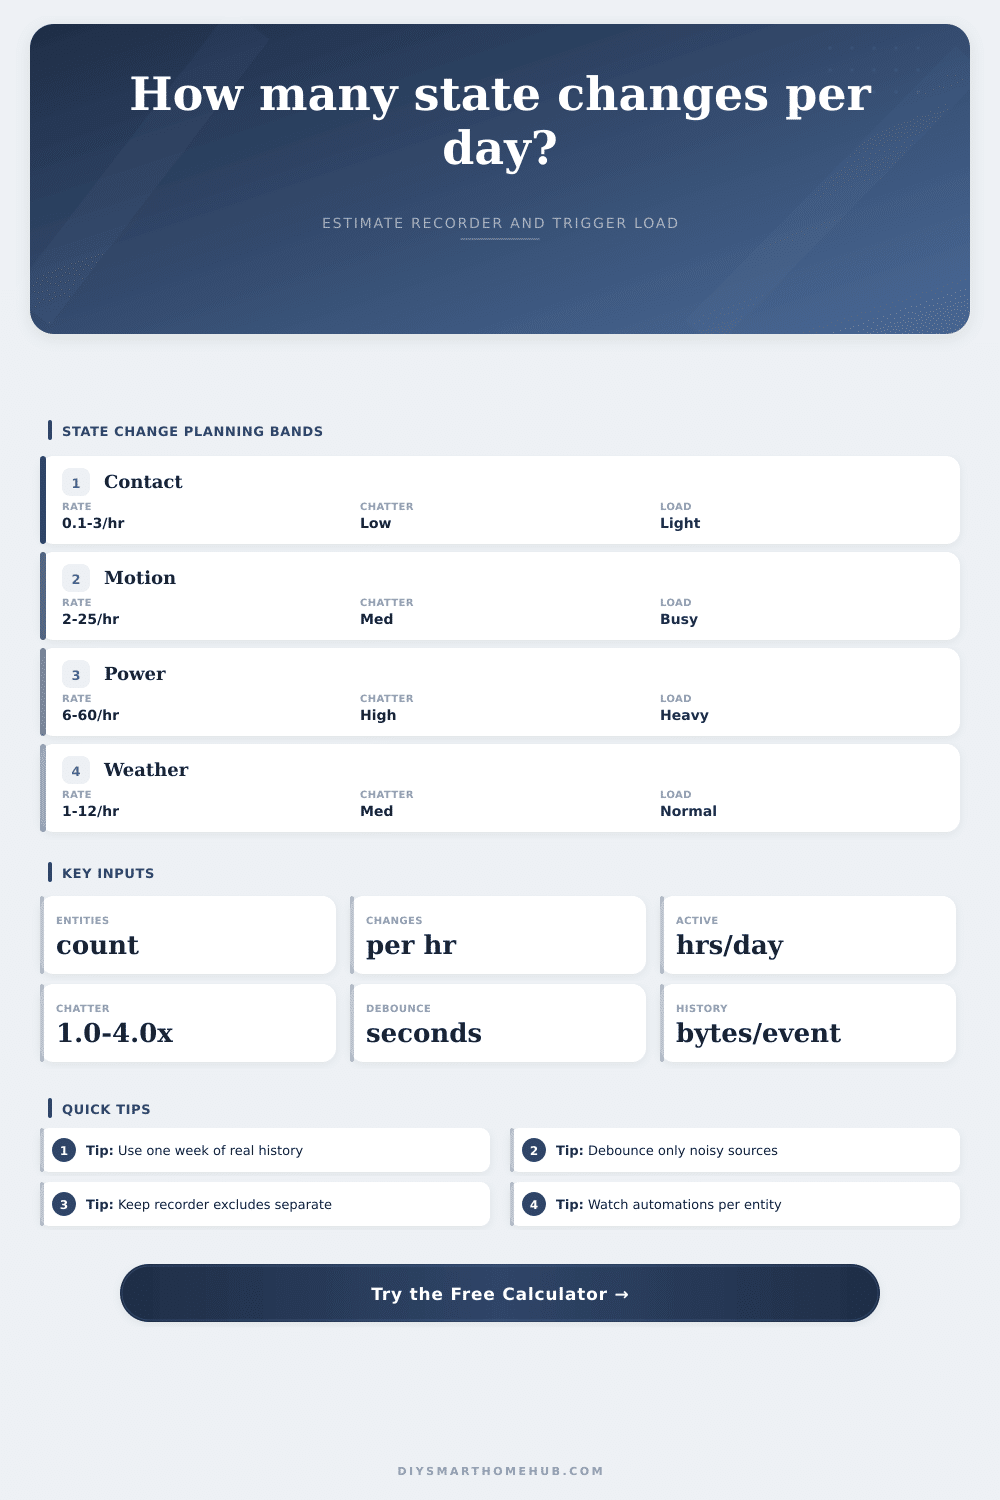
State Change Events Per Day Calculator
Estimate how many smart home entity state changes reach the recorder each day after sensor chatter and debounce filtering, then translate that event volume into storage and automation trigger load.
Daily state change estimate
| Entity group | Changes per hour | Chatter band | Bytes/event |
|---|---|---|---|
| Contact sensors | 0.1-3 | 1.00-1.20x | 350-700 |
| Motion sensors | 2-25 | 1.10-2.20x | 450-900 |
| Climate sensors | 1-15 | 1.05-1.80x | 700-1400 |
| Power sensors | 6-60 | 1.20-4.00x | 900-2200 |
| Camera motion | 5-80 | 1.30-4.50x | 500-1200 |
| Step | Formula | Output | Purpose |
|---|---|---|---|
| Base events | entities x rate x hours | events/day | Source volume |
| Chatter | base x multiplier | raw events | Repeated flips |
| Debounce | raw x reduction | removed | Noise filter |
| Recorder | retained x bytes | MB/day | History load |
| Automation | retained x listeners | triggers/day | Rule load |
| Storage/day | Band | Common source | Review focus |
|---|---|---|---|
| 0-1 MB | Light | Doors, scenes | Normal history |
| 1-10 MB | Moderate | Motion groups | Noisy entities |
| 10-50 MB | Busy | Energy data | Update rate |
| 50-200 MB | Heavy | Mixed hubs | Recorder include |
| 200+ MB | Extreme | Event storms | Exclude chatter |
| Triggers/day | Band | Common fit | What to inspect |
|---|---|---|---|
| 0-500 | Light | Manual scenes | Nothing special |
| 501-5000 | Normal | Room rules | Rule overlap |
| 5001-25000 | Busy | Motion and power | Template triggers |
| 25001-100000 | Heavy | Large hubs | Listener count |
| 100000+ | Extreme | Noisy entities | Debounce source |
Data is the first problem you will see if your smart home system are drowning. It is not because it crashes. It gets slow. Because your automations take a bit longer then usual. That’s probably because your database is busy writing down all the tiny motions of some sensor. The result: The system can’t keep pace with controlling the lights you care about.
At its heart, home automation are tracking state changes. When the temperature shifts. When a door opens. When power use goes haywire. Each time that happens, your hub record an event. Those events accumulate. Unless you tame them, they’ll fill your storage and your automations will stumble.
How to Stop Your Smart Home from Slowing Down
When you plug in the rates and number of entities, the calculator do the rest. It translates sensors activity into actual numbers for storage requirements and triggers. That’s important because most people underestimate how noisy their devices realy are. Maybe you have one motion sensor that trips whenever someone walks past. But behind-the-scenes, the sensor change status dozens of times per minute due to radio signals around it. Without any filter, each little flip become thousands of rows in the database.
First up is debounce. This is your time window that tells my system to ignore quick changes. So if the sensor flips on and off within thirty seconds, it’s likely I just don’t care. Sure, I want to know if somebody was there but I don’t want to record every bit of jittering of signal. How much of this could of been eliminated with this kind of filter? The tool estimates that for you. And the longer the window, the more the noise are cut. But there is a tradeoff. Sometimes a very long debounce window mean you miss some short events you intended to catch. You have to find right balance. The noise is gone and the signal remains.
What you’re tracking matters. A lot. A binary sensor such as a door contact is light-weight. On/off is simple, so it take little space. Power monitors and climate sensors is different. Those have precise numbers, past patterns, and specific details. Each event carry more weight. Those have numerical precision, historical trend and attributes. Each event is heavier. You can see that in the reference table on the page. That’s why a single power monitor pack can eat up storage faster then a dozen contact sensors. It isn’t only how many events but how large an event are.
The place it’s felt most is automation trigger load. Many rules may be set off by each kept event. Three automations listening for a motion sensor? That’s one event becoming three evaluations. And that load add up fast. Thousands of evaluations a day isn’t unusual in a home with lots of sensors and complicated lighting logic, like a busy kitchen. There is nothing wrong there if you have strong hardware. This is problematic if you’re doing this on a modest single-board computer.
Use realistic inputs to produce accuratly outputs. Guessing does not work. Examine a week’s worth of actual history. What was the number of actual changes by the hour for your most active entity? Use that. For repeated flips around thresholds, the calculator provide a chatter multiplier that compensates for it. It’s a crucial adjustment. A noiseless signal gets a multiplier of one. A more chatty signal could recieve a multiplier of two or three. Without this, you are left with optimistic estimates that will fail in production.
That isn’t always the best approach. Sometimes, you don’t want to store everything. That means you might have some high-chatter entities that is left out of the recorder but used for instant automations. You maintain the functionality, but keep your database lean. Get the immediacy of the response without the price of storing it over time.
Plan your event volume ahead of time, This prevents headaches down the road. When you start noticing that your daily storage is getting dangerously close to heavy band, it’s time to check your listeners. What automations is firing too frequently? Can you use more specific triggers? Can you group entities?
Often times how well you deal with all these unseen events can be the difference between a sluggish home and a responsive one. Keep your signal clean, keep the noise out. That’s how you keep your smart home… smart.